Fig. 8
Download original image
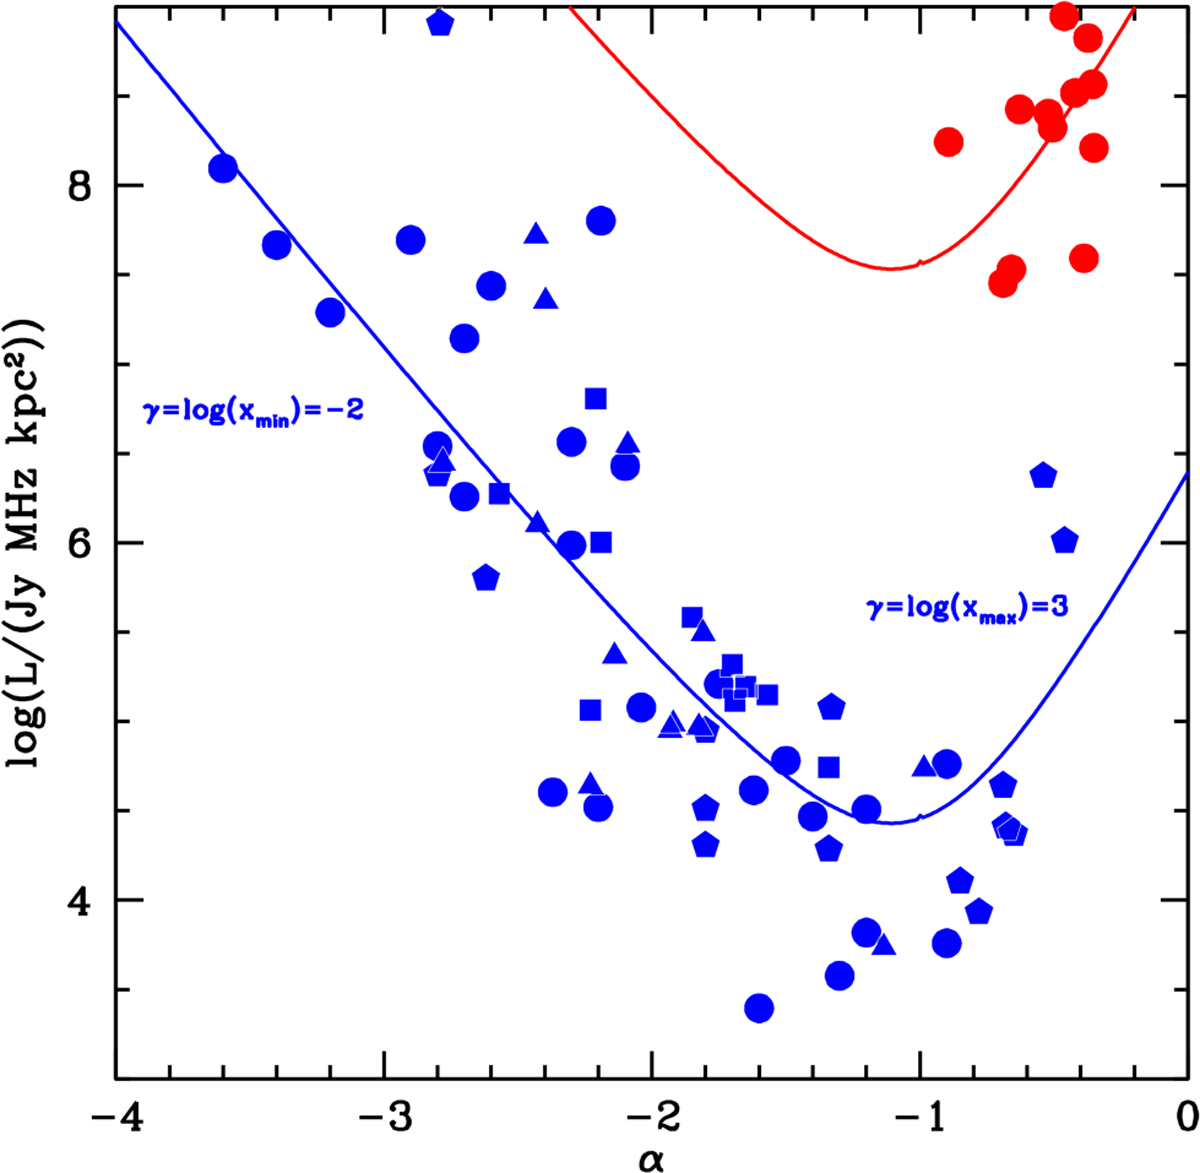
Integrated luminosity plotted against the power-law spectral index, α, for our sample of PSRs (blue symbols, as in Fig. 4) and SNRs (red symbols, from Abadi et al. 2024). The luminosity is computed by integrating the power-law flux density emission between normalised frequencies xmin = 10−2 and xmax = 103. Notice that changing the frequency range over which the integration is performed modifies the asymptotic logarithmic slopes, γ, at the low and high ends of α, corresponding to log(xmin) and log(xmax), respectively. The solid blue and red curves are derived using Eq. (8), with pre-factor parameters S*, ν*, and d given by the corresponding median values for PSRs and SNRs.
Current usage metrics show cumulative count of Article Views (full-text article views including HTML views, PDF and ePub downloads, according to the available data) and Abstracts Views on Vision4Press platform.
Data correspond to usage on the plateform after 2015. The current usage metrics is available 48-96 hours after online publication and is updated daily on week days.
Initial download of the metrics may take a while.