Fig. 7
Download original image
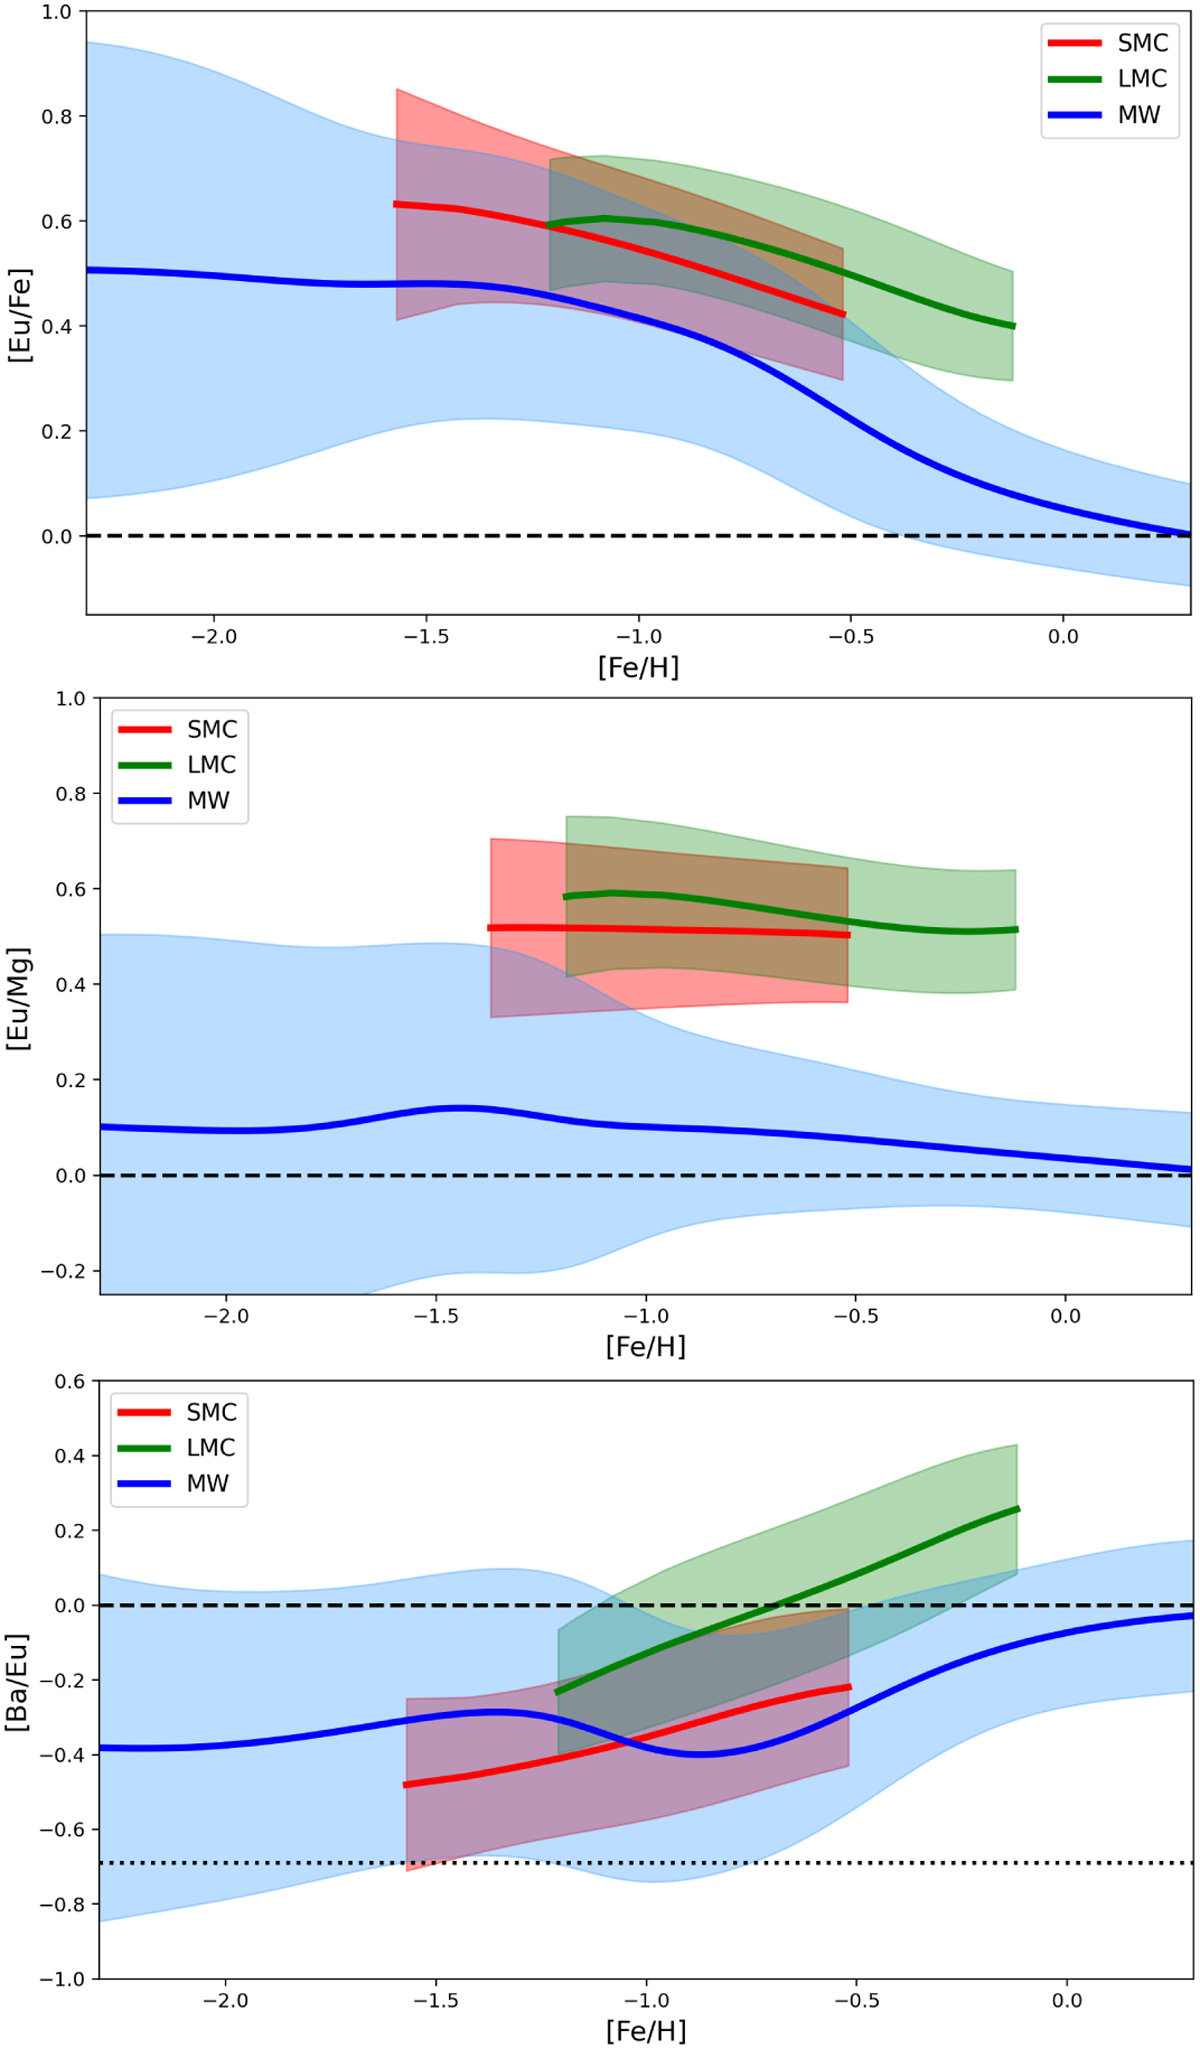
[Eu/Fe] (top panel), [Eu/Mg] (middle panel), and [Ba/Eu] (bottom panel) vs. [Fe/H] trends for the SMC, the LMC, and the MW. The solid lines are non-parametric Gaussian KDE (Kernel Density Estimation) regressions, while the shaded areas represent the 1σ confidence interval of the regressions. The black dotted line in the bottom panel marks the value below which we have a pure r-process enrichment (Arlandini et al. 1999, see also Fig. 5).
Current usage metrics show cumulative count of Article Views (full-text article views including HTML views, PDF and ePub downloads, according to the available data) and Abstracts Views on Vision4Press platform.
Data correspond to usage on the plateform after 2015. The current usage metrics is available 48-96 hours after online publication and is updated daily on week days.
Initial download of the metrics may take a while.