Fig. 5
Download original image
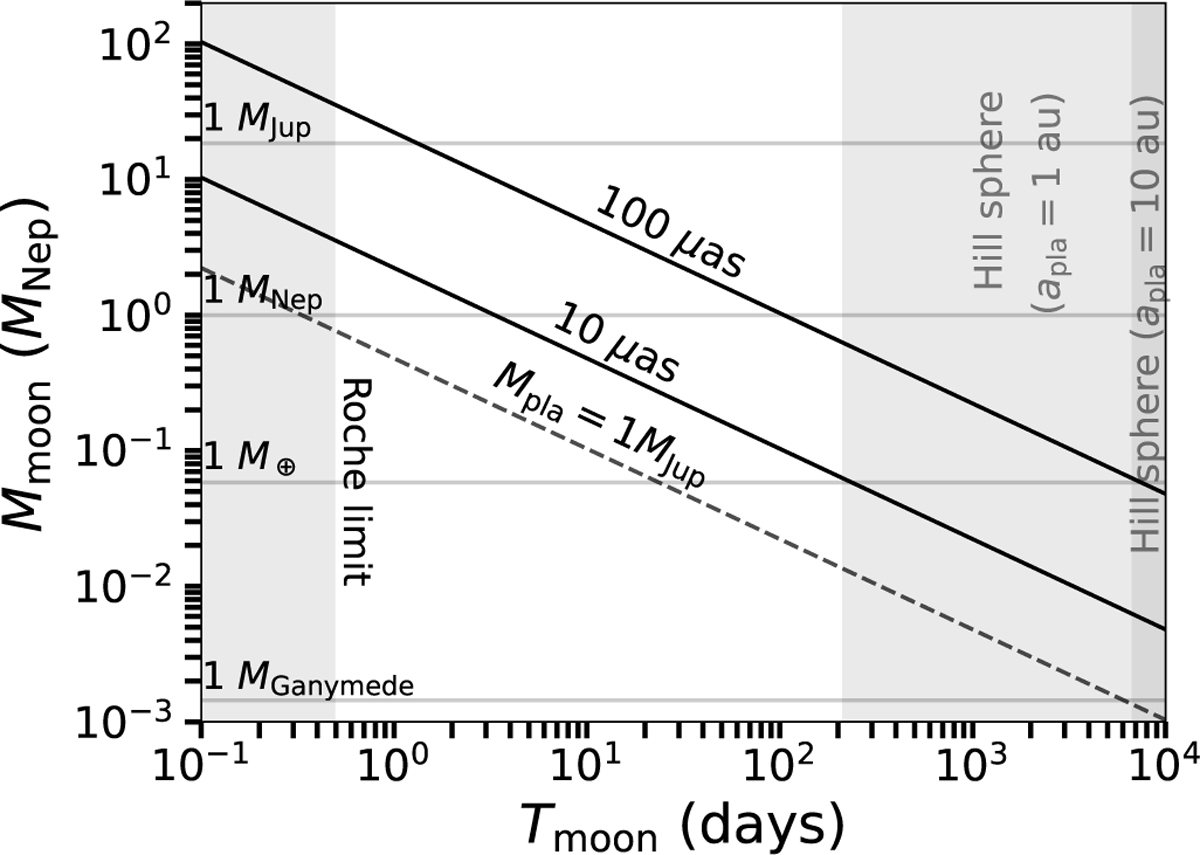
Analytical predictions of Mmoon (the mass of the moon in masses of Neptune) as a function of Tmoon (the period of the moon in days). The solid black lines show the model’s prediction for astrometric accuracies of 10 and 100 μas, as indicated on the graph. The values used are those of Eq. (6), i.e., d = 10 pc and Mpla = 10 MJup. The dotted line shows the case of 10 μas considering Mpla = 1 MJup. If the system is instead at 100 pc, the lines are pushed up by a factor of 10. The areas beyond the Roche limit and the Hill sphere are shown in grey. The Hill sphere is shown for two values of the semimajor axis of the planet apla equal to 1 (closest) and 10 au (farthest). The horizontal lines indicate moon masses of 1 MJup, 1 MNep, 1 M⊕, and 1 MGanymede from top to bottom.
Current usage metrics show cumulative count of Article Views (full-text article views including HTML views, PDF and ePub downloads, according to the available data) and Abstracts Views on Vision4Press platform.
Data correspond to usage on the plateform after 2015. The current usage metrics is available 48-96 hours after online publication and is updated daily on week days.
Initial download of the metrics may take a while.