Fig. 8
Download original image
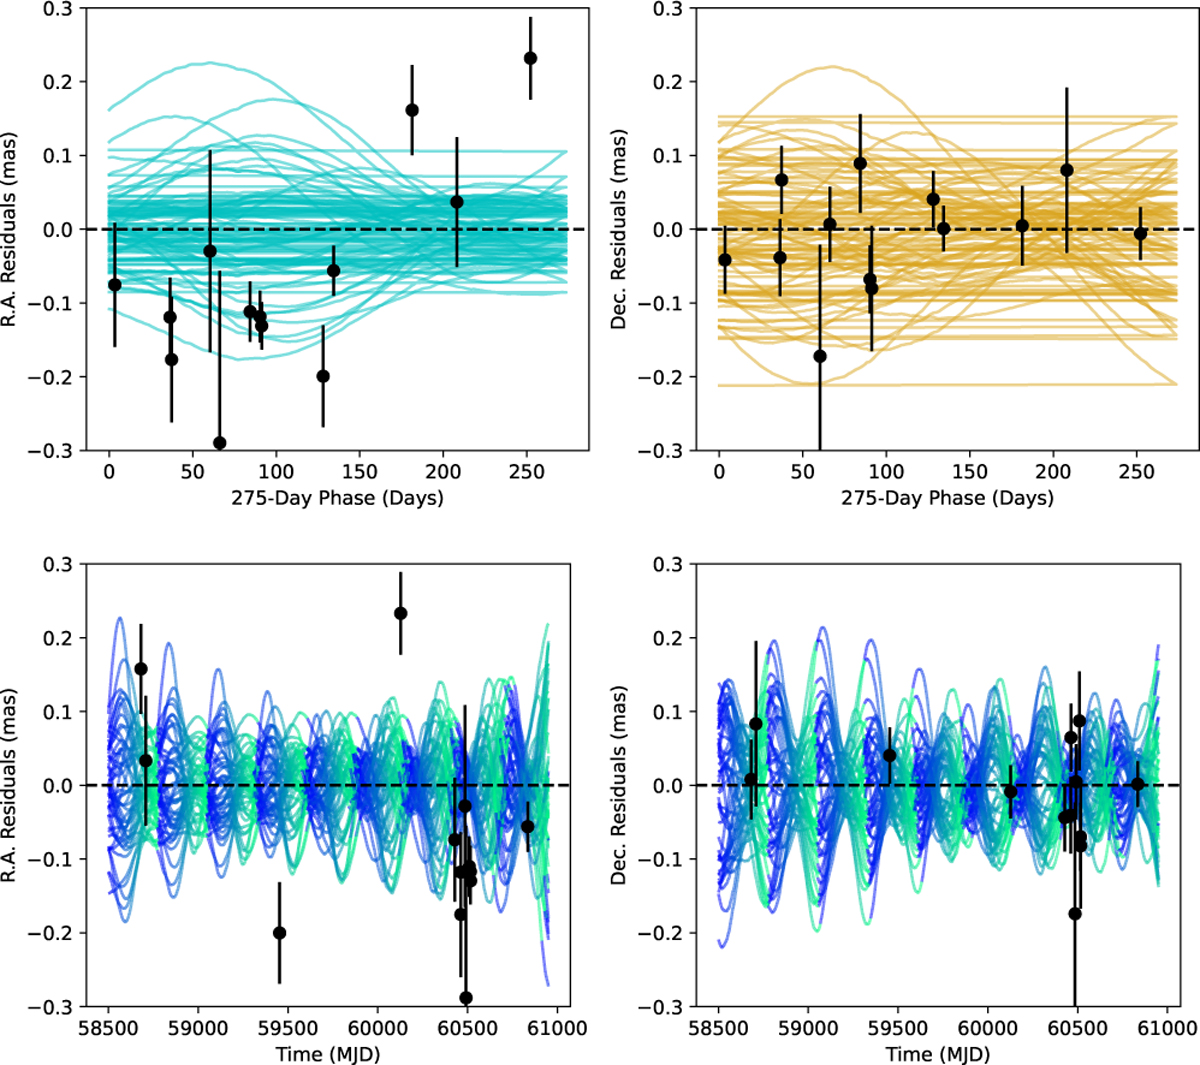
Residuals of HD 206893 B orbit after removing the average motion due to HD 206893 B orbiting the star and accounting for the motion induced by the planet c. In the top two plots, the data are phase-folded by a period of 275 days, using MJD 58500 as the starting point. 50 random draws with SMA between 0.21 and 0.26 AU are plotted in cyan for the RA and orange for the Dec Vs time plots, respectively. These model draws have the average motion of HD 206893 B removed, so they show both perturbation from the exomoon model and the residuals in the orbit of B from the average orbit of B. In the bottom plots, the data are plotted as a function of MJD and not phase-folded. The orbits are colored by orbital phase, where blue is an orbital phase of 0 and green is an orbital phase of 1. Note: the orbital periods vary between each model drawn and are slightly different from an exact 275-day orbital period.
Current usage metrics show cumulative count of Article Views (full-text article views including HTML views, PDF and ePub downloads, according to the available data) and Abstracts Views on Vision4Press platform.
Data correspond to usage on the plateform after 2015. The current usage metrics is available 48-96 hours after online publication and is updated daily on week days.
Initial download of the metrics may take a while.