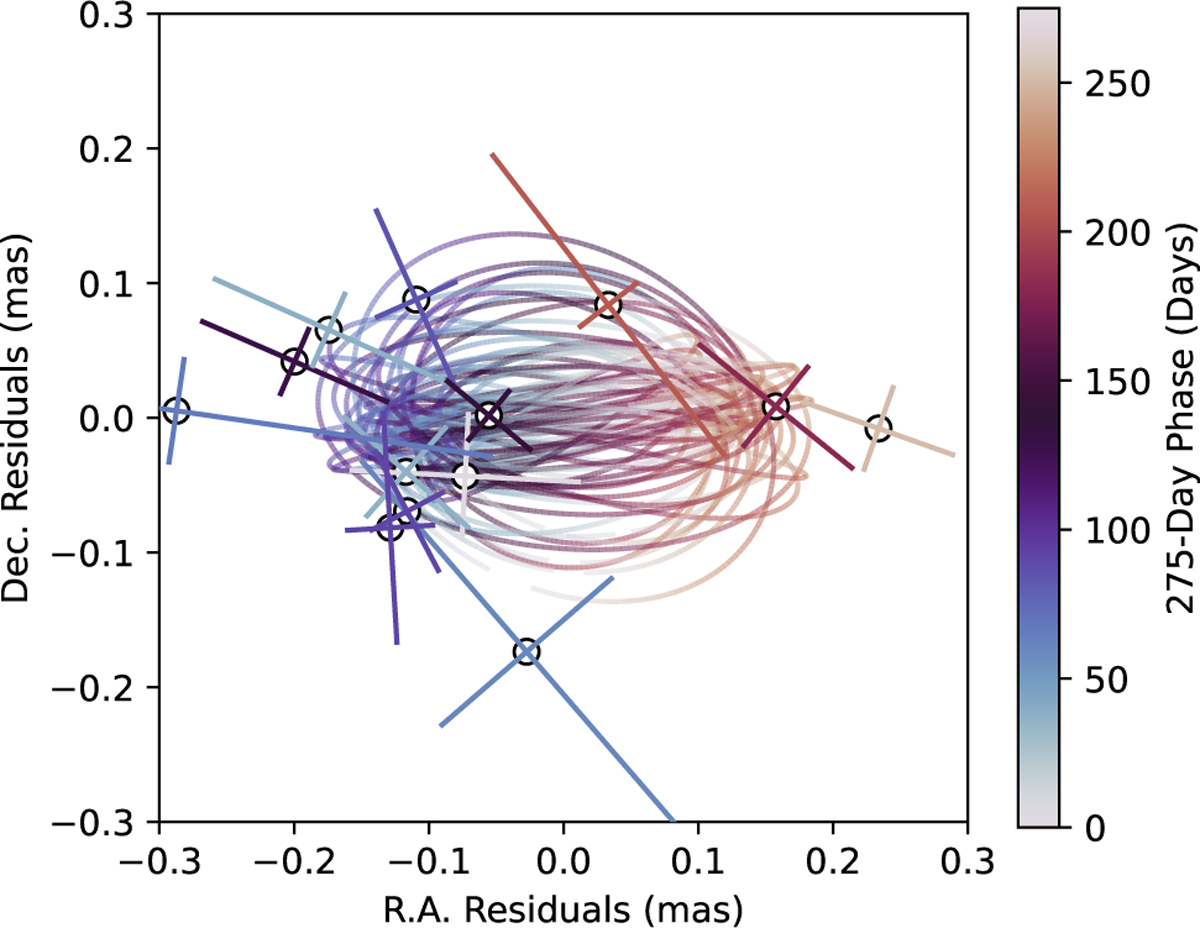
Fig. 9
Download original image
Similar residuals as Fig. 8, but projected onto the 2-D sky plane and the 50 random draws from the posterior only consider the motion of a potential exomoon (and not residual uncertainties in the orbit of B, which are shown in Fig. 8). The colors of both the data and the models correspond to the 275-day phase, as specified by the colorbar and defined in Fig. 8.
Current usage metrics show cumulative count of Article Views (full-text article views including HTML views, PDF and ePub downloads, according to the available data) and Abstracts Views on Vision4Press platform.
Data correspond to usage on the plateform after 2015. The current usage metrics is available 48-96 hours after online publication and is updated daily on week days.
Initial download of the metrics may take a while.