Fig. 4.
Download original image
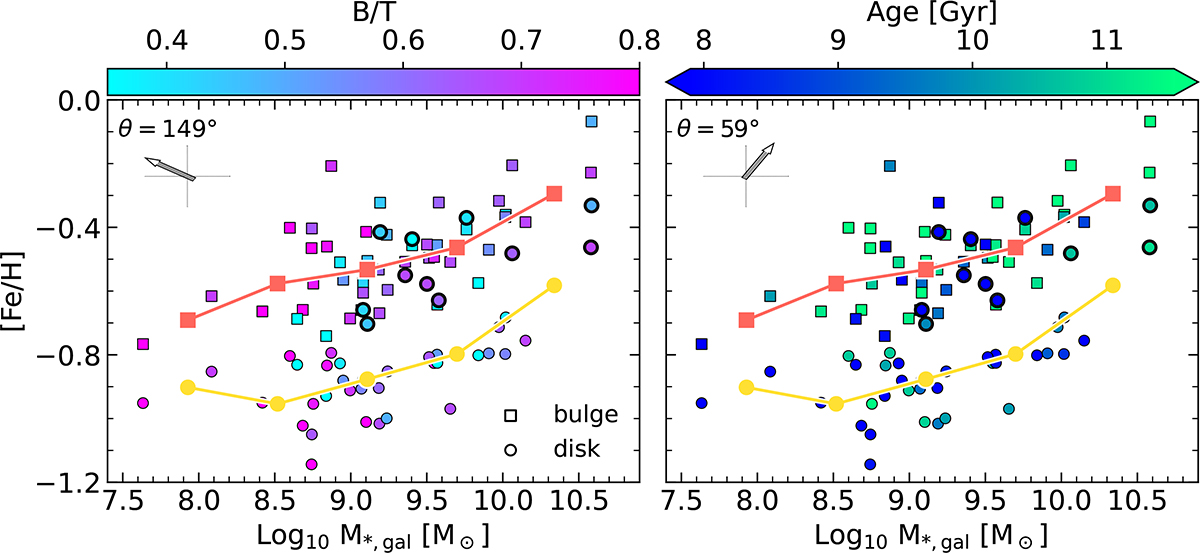
[Fe/H] for bulge (squares) and disk (circles) components as function of galaxy stellar mass. The solid lines denote the median trends for both components (orange and yellow, respectively). Left-hand panel: Plane is color-coded by bulge-total-ratio. Right-hand panel: Median age of the corresponding components. The disk components with an excess of [Fe/H], with respect to the disk MZ*R, are highlighted. To quantify third dependences of the bulge, partial correlation coefficients analysis (PCC, Bluck et al. 2020) angles are included.
Current usage metrics show cumulative count of Article Views (full-text article views including HTML views, PDF and ePub downloads, according to the available data) and Abstracts Views on Vision4Press platform.
Data correspond to usage on the plateform after 2015. The current usage metrics is available 48-96 hours after online publication and is updated daily on week days.
Initial download of the metrics may take a while.