| Issue |
A&A
Volume 705, January 2026
|
|
|---|---|---|
| Article Number | A87 | |
| Number of page(s) | 9 | |
| Section | Extragalactic astronomy | |
| DOI | https://doi.org/10.1051/0004-6361/202557133 | |
| Published online | 09 January 2026 | |
The mass-metallicity relation of bulges
1
Instituto de Astrofísica, Pontificia Universidad Católica de Chile. Av. Vicuña Mackenna 4860, Santiago, Chile.
2
Centro de Astro-Ingeniería, Pontificia Universidad Católica de Chile. Av. Vicuña Mackenna 4860, Santiago, Chile
3
Instituto de Astronomía y Física del Espacio, CONICET-UBA, Casilla de Correos 67, Suc. 28, 1428 Buenos Aires, Argentina
★ Corresponding author: This email address is being protected from spambots. You need JavaScript enabled to view it.
Received:
6
September
2025
Accepted:
9
November
2025
Abstract
Context. Bulges, located at the central regions of galaxies, are complex structures, expected to be shaped by the physical processes involved in the assembly history of their host galaxy, such as gravitational collapse, mergers, interactions, and bars. As a consequence, a variety of bulges with distinct morphologies and chemistry could be produced.
Aim. We aim to explore the existence of a stellar mass-metallicity relation of bulges, MZ*R, and analyze the possible imprint of distinctive features by accretion and migration of stars, which could store information in their assembly histories.
Methods. We used 44 central galaxies from the CIELO cosmological simulations. Their stellar masses are within the range of ∼[107.6, 1010.6] M⊙. We decomposed the galaxy into bulge and disk using the circularity and binding energies. We tracked the stellar populations in bulges back in time to their birth locations, classifying them as bulge- and disk-born, in-situ, and accreted.
Results. We find that most of the stars in our bulges are formed in-situ, but 33% of our bulges show a non-negligible contribution of stellar accretion from satellites, which could add to about 35% of the population. The accreted material is generally contributed by two or three satellites at most. In some bulges, we also find up to 32% of stars that migrated from the disk due to secular evolution, with a median of 10%. Regardless of the formation histories, we find a clear MZ*R for bulges, which is more enriched by about 0.4 dex than the corresponding relation of the disk components, and about 0.15 dex more enriched than the galaxy MZ*R. We find evidence that the dispersion in the bulge MZ*R is influenced by both stellar accretion from satellites and migration from the disk, such that, at a fixed bulge mass, bulges with higher fractions of accreted and migrated stars tend to be less metal-rich. Therefore, we find a MZ*R for bulges, which is consistent with an increase in metallicity with increasing mass, while its dispersion stores information on the contribution from different formation channels.
Key words: galaxies: bulges / galaxies: formation / galaxies: interactions / galaxies: stellar content
© The Authors 2026
 Open Access article, published by EDP Sciences, under the terms of the Creative Commons Attribution License (https://creativecommons.org/licenses/by/4.0), which permits unrestricted use, distribution, and reproduction in any medium, provided the original work is properly cited.
This article is published in open access under the Subscribe to Open model. This email address is being protected from spambots. You need JavaScript enabled to view it. to support open access publication.
1. Introduction
The observed diversity of galaxy morphology could be related to their different formation paths. In the local Universe, galaxies are traditionally classified using the Hubble sequence, which arranges them along a morphology, from spheroidal to disk-dominated (Hubble 1926). The central region of disk galaxies, called the bulge, has distinct kinematics and chemical abundances. Early studies classified the bulge as analogous to an elliptical galaxy (Eggen et al. 1962; Noguchi 1999). However, this view has been challenged by more recent studies, which show that bulges are more complex stellar structures and often exhibit significant rotational support. Bulges are commonly classified into two broad categories: classical bulges, which present dispersion-dominated stellar populations, and pseudo-bulges, which correspond to a composite of a classical bulge, a disk-like component, and sometimes a bar (e.g., Fisher & Drory 2010; Kormendy 2016; Breda et al. 2020). The Milky Way is a clear example of a galaxy with a complex bulge in which these three components coexist (Zoccali et al. 2017; Rojas-Arriagada et al. 2019; Queiroz et al. 2021)
The formation of the dispersion-dominated component of bulges has been attributed to fast and violent processes, such as the gravitational collapse of a proto-galaxy (Avila-Reese & Firmani 1999), or major mergers that triggered strong starbursts (Hopkins et al. 2008; Méndez-Abreu et al. 2014). Their origin appears to be distinct: numerical simulations report the formation of pseudo-bulges with varying degrees of rotation (Guedes et al. 2011; Gargiulo et al. 2019), while secular processes have been found to play a positive role in their build-up (e.g., Kormendy & Kennicutt 2004; Eliche-Moral et al. 2011; Rosito et al. 2019; Gargiulo et al. 2022). Together, these results suggest that bulge formation proceeds through multiple evolutionary pathways, ranging from rapid and violent events to slower, secular processes shaping the central regions of galaxies. Additionally, the formation of clumps in early gas-rich disks, which later migrate and fall into the central regions of galaxies, has been reported to be another channel for bulge growth (Bournaud 2011; Perez et al. 2013; Debattista et al. 2023). Since different mechanisms may operate in bulge formation, with potentially distinct efficiencies as a function of redshift (Debattista et al. 2023), their chemical signatures could provide a valuable diagnostic to disentangle the relative contributions of these processes.
The chemical evolution of galaxies is closely related to the physical processes that drive galaxy assembly (e.g., Tinsley 1980; Pagel 1997; Chiappini et al. 1997; Maiolino & Mannucci 2019). One of the most fundamental relations in this context is the mass–metallicity relation (MZR), which connects the galaxy stellar mass to the metallicity of its star-forming gas (Lequeux et al. 1979; Skillman et al. 1989; Zaritsky et al. 1994; Tremonti et al. 2004). This correlation has been well established for decades, both in the local universe (e.g., Tremonti et al. 2004; Zahid et al. 2014), and at high redshift (e.g., Lewis et al. 2024; Cheng et al. 2024). The prevalence of this relation has been studied up to redshift z ∼ 7 and beyond, with the contribution of the James Webb Space Telescope (Stanton et al. 2024). It is commonly interpreted as reflecting the ability of higher-mass galaxies to retain metals more efficiently, thereby reaching higher metallicities. Numerical simulations are able to reproduce the MZR, at least in the low redshift universe (e.g., De Rossi et al. 2017; Zenocratti et al. 2022). Similarly to the gas, the stellar mass-metallicity relation is also in place (Gallazzi et al. 2005; Kirby et al. 2013). This relation has a similar shape to that of MZR, but it reflects the cumulative evolutionary history of the interstellar medium (ISM), since stars inherit the chemical abundances of the gas from which they form. The stellar metallicities trace the integrated history of the stellar populations in a galaxy. Traditionally, stellar metallicity has been derived by fitting spectral energy distributions of composite stellar populations to the integrated spectra of galaxies (Conroy 2013). However, in recent years, with the use of integral field units (IFUs), it has become possible to determine the 2D distribution of stellar population properties, giving rise to the so-called resolved relations MZR (González Delgado et al. 2014; Camps-Fariña et al. 2021; Baker et al. 2023). Recently, Jegatheesan et al. (2024) analyzed a large sample of galaxies from the MaNGA survey and found that galaxies with different morphologies follow distinct assembly histories, with their bulge and disk components displaying a wide diversity of metallicities and ages.
In this paper, we aim to study the MZ*R of bulges for the first time, to our knowledge. We analyze the relation between the scatter of the MZ*R and the assembly history of the bulges. Although most stellar populations in bulges are expected to form in-situ (Gargiulo et al. 2019), a fraction could form in the disk and then migrate (Debattista et al. 2023), or could even be accreted (Romano et al. 2023). If bulges are composed of stars formed from different channels, they might leave an imprint on the bulge MZ*R.
This paper is organized as follows. Section 2 describes the simulations and the galaxy sample. In Section 3, we analyze the bulge MZ*R and the contribution of stellar populations originating from different channels. Section 4 explores the various formation scenarios. Finally, Section 5 presents our conclusions and summarizes the main findings.
2. The CIELO galaxies
As mentioned above, cosmological simulations are powerful tools for studying the aforementioned diversity of processes that could take place in the formation of bulges (e.g., Tissera et al. 2006; Gargiulo et al. 2022; Fragkoudi et al. 2017). Hence, in this work, we use the cosmological simulations from the Chemo-dynamIcal propertiEs of gaLaxies and the cOsmic web, the CIELO Project (Tissera et al. 2025). This set of simulations has been previously used to study the evolution of galaxies in the Local Group (Rodríguez et al. 2022); the impact of baryons on the dark matter shape (Cataldi et al. 2023); the channel of formation of stellar halos (Gonzalez-Jara et al. 2025);the shape of the metallicity gradients (Tapia-Contreras et al. 2025);and the possible contribution of primordial black holes to the dark matter component (Casanueva-Villarreal et al. 2024). We note that the CIELO galaxies have already been shown to determine a stellar and star-forming gas MZR in global agreement with observations (Tissera et al. 2025).
Here we provide a description of the CIELO simulations and the galaxy sample selected for this work.
2.1. The simulations
The CIELO project encompasses cosmological hydrodynamical simulations of zoom-in regions, consistent with a Λ-CDM cosmological scenario with Ω0 = 0.317, ΩΛ = 0.6825, ΩB = 0.049, and h = 0.6711 (Planck Collaboration XVI 2014). The CIELO project includes zoom-in regions selected from a 50 Mpch−1 side-box volume to cover a diversity of environments while avoiding massive groups or clusters, as well as two Local Group analogs extracted from a 100 Mpc h−1 side-box volume. The target halos were selected to have virial masses in the range of [1011 − 1013] M⊙, and the surrounding region of about 1 Mpc radius was resampled at the same level of resolution. The initial conditions are explained in detail in Tissera et al. (2025). Simulations with two numerical resolution levels are used, with dark matter particles of mdm = 2 × 10⁵ M⊙ and mdm = 1.91 × 10⁶ M⊙ for high and intermediate resolution levels. The initial gas masses are mgas = 3.12 × 10⁴ M⊙ and mgas = 2.98 × 10⁵ M⊙, respectively. For the high resolution level, the gravitational softening length is ϵdm = 500 pc for dark matter and ϵgas = 250 pc for gas and stars. The intermediate resolution has values of ϵdm = 800 pc and ϵgas = 400 pc.
Details of the simulations can be found in Tissera et al. (2025). Briefly, simulations were performed using a version of GADGET-3 (Springel & Hernquist 2003; Springel 2005) that includes metal-dependent radiative cooling and multiphase treatment for the ISM (Scannapieco et al. 2006). Chemical enrichment and energy feedback from Type Ia (SNIa) and Type II (SNII) supernovae are also included (Mosconi et al. 2001; Scannapieco et al. 2005), following 13 individual isotopes. The SNII were assumed to originate from stars more massive than 8 M⊙, with nucleosynthesis products from the metallicity-dependent yields of Woosley & Weaver (1995) and lifetimes from the mass–metallicity–dependent prescriptions of Raiteri et al. (1996). For SNIa, the W7 model (Iwamoto et al. 1999) was adopted, assuming progenitor lifetimes randomly distributed in the range of 0.7–1.1 Gyr; see Jiménez et al. (2015) for a discussion on this. The number of SNIa events was estimated from an observationally motivated SNII-to-SNIa rate ratio (Mosconi et al. 2001). The adopted initial mass function is consistent with Chabrier & Lenoble (2023).
The virial halos were identified using the Friend-of-Friends algorithm (FoF, Davis et al. 1985), and the SUBFIND code (Springel et al. 2001; Dolag et al. 2009) was applied to select subhalos within the virial radius. The merger trees were built using the AMIGA package (Knollmann & Knebe 2009), as explained by Tissera et al. (2025). We used the CIELO data base prepared by Gonzalez-Jara et al. (2025).
2.2. The simulated galaxies
We selected 44 central galaxies, with a central galaxy defined as the most massive system within a virial halo. The stellar masses of simulated galaxies are in the range of [107.6 − 1010.6] M⊙. All selected galaxies are resolved with more than 8000 stellar particles. We note that galaxies with stellar masses lower than 109 M⊙ were selected from the high resolution run only.
The dynamical components of galaxies, bulge, disk, and stellar halos, were identified by using the AM-E method as explained in Tissera et al. (2012). This method defines the circularity parameter,  , where Jz is the angular momentum perpendicular to the rotational plane of each particle, and Jz,max is the maximum angular momentum possible for a given binding energy, Ebind. Hence, stars on perfect circular orbits in a plane have ϵ = 1; conversely, dispersion-dominated systems have ϵ ∼ 0. This, together with a threshold in Ebind, allows the classification of stellar particles into different components. The bulge is defined by the stellar particles with Ebind lower than the minimum energy at 0.5 Ropt1, meaning that all stellar particles with lower binding energies are classified as part of the bulge. On the other hand, the disk component is defined as the stellar particles with |ϵ|> 0.5 and located within 2×Ropt. These criteria have previously been used to study CIELO galaxies (Gonzalez-Jara et al. 2025; Tissera et al. 2025; Tapia-Contreras et al. 2025), so we kept them for consistency. With this classification, we can also estimate the bulge-to-total mass ratio, B/T. The selected galaxies have B/T in the range of 0.20 to 0.85. Hence, our sample encompasses a broad variety of morphologies, with different relative importance of the bulge and disk components.
Regarding the formation channels of the stellar populations in the simulated bulge components, we followed all stellar particles back in time to their site of formation and classified them accordingly. We grouped them as accreted if they were born from material bound to accreted satellites at their time of formation, and as in-situ if they were formed within the progenitor of a given galaxy (i.e., within 1.5 Ropt). The most massive system in a halo is defined as the progenitor at a given time. Furthermore, the in-situ stellar populations are also divided into two subgroups, depending on whether they formed within the bulge component2, hereafter bulge-born (BB), or the disk component, hereafter disk-born (DB). In the latter case, these stars migrated into the bulge, probably as a result of local instabilities (Bournaud 2011), tidally-induced torques produced by nearby companions (Perez et al. 2013) or by the effects of the presence of a bar (Gargiulo et al. 2022; Fragkoudi et al. 2025).
Figure 1 shows, as a function of bulge mass, the stellar mass fractions, fsp, of three distinct populations in the bulge, separated by their formation channel: BB, DB, and accreted. As can be seen, the predominant formation channel is the in-situ formation of stars from gas already present in the bulge (BB), with fsp varying from nearly 1 to 0.60. However, as we go to higher masses, the contributions of accreted and DB increase slightly. In particular, ∼30% of the galaxies in the sample tend to have accretion fractions (facc) higher than facc = 0.20. Therefore, the two main formation channels we identify are bulge-born (BB) and accreted stars. However, some galaxies also show significant contributions from DB populations3, as illustrated in Fig. 1.
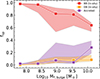 |
Fig. 1. Mass fraction of stellar populations contributing to bulges. Stars formed in-situ (red dots and shaded regions), accreted stars (violet dots and shaded regions), and stars formed in the disk component and subsequently incorporated into the bulge through secular evolution (yellow dots and shaded regions) are shown. The median values (dots and lines) and the 16th–84th percentiles (shaded regions) of each of the different populations are depicted. |
To better quantify the origin of the accreted stellar populations, we identified the satellites to which the accreted material was bound. This allowed us to track the number of satellites that contribute to the formation of a given stellar population in the bulge. Figure 2 shows the cumulative accreted contribution to the bulge as a function of the number of major contributors. To obtain the major satellite contributors, we only included bulges with accreted masses higher than 106 M⊙ and 107 M⊙ for intermediate- and high-resolution simulations, respectively (i.e., if bulges have at least 50 accreted particles). This is done to reduce numerical noise where there are a low number of particles. We note that our results do not depend on this adopted numerical limit if it remains low, since we are mainly concerned with galaxies with a significant accretion fraction.
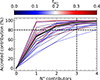 |
Fig. 2. Cumulative contribution of satellites to accreted stellar populations, according to number of major contributors. The cumulative tracks are color-coded by the accreted fraction of the corresponding bulges. As a reference, lines at 80% and three contributors are depicted. The median trend of the contributions is included for reference (solid black line). |
As can be seen in Fig. 2, while there is a variety of accreted fractions, most bulges reach at least 80% of their accreted stars by the contribution of two or three accreted satellites. There is a slight trend for bulges with facc < 0.2 to have a larger number of contributors. This could be due to the accretion of stripped particles mainly at high redshift, where the assembly history is more chaotic. These small bulges do not have main accretion events.
3. The stellar mass-metallicity relation of bulges
We estimated the median [Fe/H] of the stellar populations in the simulated bulges and disks and built the corresponding MZ*R4. Figure 3 displays these relations and those of the galaxies as a whole. The disk and bulge components determine an MZ*R with similar shapes, but with a different level of enrichment. The Pearson correlation coefficients (r) show a well-defined correlation for all cases (p-values are all lower than p < 0.001). As can be seen in Fig. 3, the bulges tend to be more enriched than the disks.
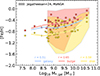 |
Fig. 3. MZ*R of bulges (red squares) and disks (yellow circles) of CIELO galaxies, defined by median [Fe/H]. For comparison, the CIELO galaxy MZ*R is also included (light blue line). Additionally, observational trends reported by Jegatheesan et al. (2024) for the bulges (red shaded regions) and disks (yellow shaded regions) are also included. Shaded regions are determined by the 16th–84th percentiles. |
The simulated trends are consistent with those of the MaNGA survey reported by Jegatheesan et al. (2024, shaded regions). We note that these authors applied BUDDI (Johnston et al. 2017) to decompose bulge and disk components using 2D light profiles. This procedure is different from our bulge and disk decomposition (see Section 2.1). Hence, our aim is not to make a detailed comparison, but rather to compare the global trends of the corresponding MZ*R. To match the enrichment levels between observations and simulations, we rescaled the observational data to match the median abundances of the CIELO galaxies at M∗,gal ∼ 109.5 M⊙. This corresponds to a downward shift in [Fe/H] of 0.21 dex. We made these correlations as the methods for determining the abundances in observations and simulations are different.
As shown in Fig. 3, bulges tend to be more enriched than disk components, although in some cases both exhibit similar levels of enrichment. This trend is expected, considering that the bulges host stellar populations born in the central regions, which are very dense, and hence experienced strong starbursts. The disks continued to accrete gas and form stars in a more steady fashion. Nevertheless, there is some overlap with a subsample of galaxies that also exhibit enriched disks, in agreement with observations.
To compare the galaxy morphology and the ages of the components, Fig. 4 shows the MZ*R of the bulge and disk color-coded by the galaxy B/T in the left panel, and the median age of the corresponding component in the right one. From the left panel we see weak secondary correlations with B/T, so that lower mass galaxies tend to be more bulge-dominated. To quantify this dependence, we estimated the correlation angle using PCC analysis (Bluck et al. 2020). For the third correlation with B/T, the angle is 149 with a bootstrap error of 20, suggesting a decrease in B/T for an increase in the bulge M*. The right panel of Fig. 4 shows that more massive bulges tend to be slightly older. The PCC analysis supports this with an angle of 59 ± 44. Considering the large bootstrap error, this angle should be taken just as a reference of the relative direction of the third correlation.
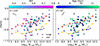 |
Fig. 4. [Fe/H] for bulge (squares) and disk (circles) components as function of galaxy stellar mass. The solid lines denote the median trends for both components (orange and yellow, respectively). Left-hand panel: Plane is color-coded by bulge-total-ratio. Right-hand panel: Median age of the corresponding components. The disk components with an excess of [Fe/H], with respect to the disk MZ*R, are highlighted. To quantify third dependences of the bulge, partial correlation coefficients analysis (PCC, Bluck et al. 2020) angles are included. |
Regarding the disk components, the median MZ*R is determined by the bulk of the systems, and the metallicity is about 0.34 dex lower than that of the bulges. In the case of MaNGA, the disk MZ*R is about 0.6 dex more metal-poor than the bulges. However, some simulated disks exhibit higher metallicities. These systems lie along the bulge MZ*R (black contours). Some of them display prominent disk components populated by younger stellar populations. They have a median B/T of  and a median age of
  Gyr. Meanwhile, most of the disk components have a median B/T of
  and median ages of
  Gyr (the lower and upper numbers correspond to the 16th and 84th percentiles). Those galaxies with younger disks continue their star formation, probably due to continuous gas accretion, which also contributes to the formation of disks (Yu et al. 2023). However, our analysis shows an important variation of properties that reflect the complex formation processes of bulges. In the preceding analysis, the disk properties were included for completeness, but the analysis hereafter focuses exclusively on the bulge components.
To further analyze the properties of the three stellar populations that form the bulges, we estimated the offset between the metallicity of a given stellar population, and the metallicity predicted by the bulge MZ*R for the corresponding bulge mass as [Fe/H]−[Fe/H]MZ∗R. Figure 5 compares the level of enrichment and ages of BB (red), DB (yellow), and accreted (purple) stars. The left panel of Fig. 5 shows the offset of metallicity as a function of the bulge stellar mass, whereas the right panel displays the offsets as a function of the median age of each stellar population. An important aspect of this estimation is that we only consider a stellar population if it is resolved with more than 50 stellar particles, in order to minimize numerical noise.
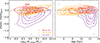 |
Fig. 5. Offset between metallicity of given stellar population and metallicity predicted by bulge MZ*R for corresponding bulge mass as [Fe/H]−[Fe/H]MZ∗R. We considered accreted (purple), disk-born (gold), and bulge-born (orange) stellar populations. Left panel: Metallicity offset as a function of the stellar mass of the bulge. Right panel: Median age of the stellar population itself. The lines correspond to the density contours at 20%, 40%, 60%, and 80% of each distribution. |
We find that the metallicity of the in-situ stellar populations is closer to the bulges MZ*R, as expected, since they are the predominant population. The DB populations exhibit enrichment levels comparable to the BB ones, although they display a mild trend of increasing metallicity with stellar mass. This is likely due to the more enriched ISM of higher-mass galaxies, where these stars originated before migrating to the bulge. Finally, the accreted stellar populations are in general less enriched compared to the in-situ populations. This is expected, since the major contributors of these accreted stellar populations to the bulges are low mass satellite galaxies, with less enriched ISM. In Fig. C.1, we show the MZR of the three main satellite contributors to the bulges, together with the bulge MZR (see Sect. C). From this figure, it is also clear that less massive satellites entered the virial radius at higher lookback times, and hence did not have time for chemical evolution to take place.
The right panel of Fig. 5 shows that the accreted populations tend to be as old as the in-situ BB stars. The difference between these two populations is the level of enrichment. In contrast, DB stars have a wider range of ages, but in general are younger than the other populations. This is expected, since disks typically form at later evolutionary stages and continue to form stars over extended periods.
According to these results, accreted stars decrease the overall metallicity of the bulge, depending on the relevance of their contribution. To quantify this effect, the left panel of Fig. 6 presents the bulge MZ*R, color-coded by facc. We applied the LOESS2D algorithm to highlight the dependence on facc (Cappellari et al. 2013). For bulges with M* lower than 108.5 M⊙, there is no clear correlation between the metallicity relation and the accretion fractions. However, the number of galaxies in this mass range is too low to draw a conclusion. Conversely, for M∗ > 108.5 M⊙ we find a dependence on facc, so that at a given bulge mass, those with lower metallicity tend to have a larger accreted contribution.
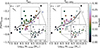 |
Fig. 6. Mass-metallicity relation for the simulated bulges color-coded by accreted fraction, facc (left panel) and the accreted plus the DB fraction, fex − situ (right panel). The LOESS2D smoothing algorithm was applied to highlight the trend (Cappellari et al. 2013). The inset figure shows the distribution without LOESS2D for the mass range of interest for comparison (i.e. the actual facc, fex − situ values.). As a reference, the Milky Way bulge measurements of stellar mass (Portail et al. 2017) and median [Fe/H] (Zoccali et al. 2017) are included (black star). |
As noted previously, some bulges also exhibit contributions from DB stellar populations that migrate toward the central region. Hence, we also define fex − situ as the combined fraction of accreted and DB stars. The right panel of Fig. 6 shows MZ*R as a function of fex − situ. Adding the DB contribution reinforces the trend initially seen with facc alone, indicating that bulges with lower metallicities are associated with larger fractions of stars formed outside the bulge.
The PCC angle shows the direction in which the third correlation, in this case with facc and fex − situ, increases with the bulge MZ*R. The correlation angles, θ, present similar values for both relations, with bootstrap errors less than 4°. We stress the fact that this trend is not a direct correlation between the bulge mass and the total galaxy mass. Although bulge mass does correlate with stellar mass along the MZ*R (i.e., more massive bulges are typically found in more massive galaxies), this relation does not account for the dispersion at a given bulge mass, as shown in Fig. B.1.
The trend of lower metallicities in bulges with higher facc, at a given stellar mass, is clear. More massive galaxies are expected to have more mergers, increasing the probability of having a higher contribution of accreted stars in the bulge (Angeloudi et al. 2024). Meanwhile, the contribution of DB stars produces a similar effect because these stars are less enriched, in general, as galaxies show negative metallicity profiles (Tapia-Contreras et al. 2025).
We also include in both panels of Fig. 6, a zoom-in view of the intermediate mass range (108.5 − 1010 M⊙) without LOESS2D smoothing, to assess that there are no spurious results originating from using this smoothing procedure. First, we can see that the results hold, indicating that the less metal-rich galaxies tend to have higher accretion fractions. Second, there are outliers that exhibit higher facc and higher metallicity (i.e., when a very massive merger occurred), for example. Together, these findings highlight the diversity of bulge assembly pathways.
In summary, we detect MZ*R for bulges, which follows the overall increasing trend of the galaxy MZ*R but at higher enrichment levels. We find that part of the scatter in this relation is linked to the assembly history of bulges, such that those with larger contributions from accreted and DB populations tend to shift toward lower metallicity at a given bulge mass. Nevertheless, some systems deviate from this trend, and in the next section, we discuss the origin of this diversity.
4. Assembly histories of bulges and the MZ*R
In order to further analyze the formation histories of the bulges, we estimated the cumulated stellar mass as a function of age and calculated the lookback time at which 50% and 70% of the stellar population in the bulges were formed, T50 and T70 respectively. In Fig. 7 we show the metallicity offsets of individual bulges with respect to the MZ*R, Δ[Fe/H]bulges, as a function of T50−T70. The left panel shows the third dependence on facc, while the right panel shows the dependence on fex − situ.
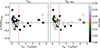 |
Fig. 7. Offset of [Fe/H] with respect to the median MZ*R, Δ[Fe/H]bulges, as a function of the difference between the two formation times, T50 and T70. We show the secondary dependence of the offset on the facc (right panel), and fex − situ, defined as the sum of facc and the fraction of DB stars (left panel). The separation in fast and bursty formation history is given by a threshold in T50 – T70 ∼ 1 (red vertical line). |
The difference between these times provides a way to discriminate between bulges with fast formation histories. From this figure we can see that most bulges are concentrated at T50 − T70 ≤ 1 Gyr, which implies T50 ∼ T70. We adopt this age threshold to define the bulge with fast formation. The rest of the system with bursty or extended formation is assumed to have T50 − T70 > 1 Gyr. For our sample, we estimate that ∼67% of the bulges are consistent with a fast formation path.
As can be seen in the left panel of Fig. 7, bulges with fast formation and high accretion tend to have negative offsets. However, there are also bulges that fall below the median MZ*R that have fast formation and low accretion. When we include both fractions together, as shown in the right panel of Fig. 7, we can see that the trend is stronger and most fast forming bulges with negative offsets have high fex − situ. This can be understood because bulges with low accretion, facc < 0.2, and fast formation have a median fDB of  % for negative offsets and
  % for positive offsets (lower and upper numbers represent the 16th and 84th percentiles). The different fDB of offsets from the bulge MZ*R suggests that migration of stellar populations from the disk could also affect the median [Fe/H]. Some of them received old, low metallicity stars while others have later contributions of younger, more metal-rich stars. There is only one exception, the most massive bulge with a fast formation and a positive offset, which had a major merger that contributed to high metallicity stars.
However, bulges with bursty star formation and an excess of [Fe/H] tend to have a larger fraction of fex − situ, which is reinforced by DB stars. We find that fDB for low accretion is  % for negative offsets and
  % for positive offsets. For high accretion, fDB is
  % for negative offsets and
  % for positive offsets. In this case, the larger contribution of migrated stars could have brought more enriched material, since these bulges have an extended formation history. In fact, the DB stars are in median ∼2 Gyr younger for the bursty scenarios, when compared to the fast forming ones, suggesting that they are being formed in a more enriched ISM. However, caution should be taken with regard to the results on bursty bulges because of the low number of systems.
In summary, we find that the formation history of bulges determines an MZ*R, and that the dispersion of this MZ*R is affected by both stellar accretion from satellites and migration from the disk, so that at a given bulge mass, those with larger fex − situ tend to be less metal-rich.
5. Conclusions
We performed a chemo-dynamical analysis of the bulges of 44 central galaxies of the CIELO simulations. We built up the MZ*R of bulges and showed that the dispersion at a given bulge mass could be related to the accretion history.
Our main results can be summarized as follows:
-
We found three channels of formation of stellar populations in the CIELO bulges. Most of the stellar populations are formed in-situ. However, about 33% of the simulated bulges have facc > 0.2. The third channel of formation are stars born in the disk component and later acquired by the bulges via secular evolution. They can contribute up to about 32% of the stellar populations in the most massive bulges. We found a trend with the bulge mass, in which bulges with greater mass have a more significant contribution to the last two channels.
-
We found that bulges follow an MZ*R similar in shape to the galaxy MZ*R, but at least for the CIELO simulations, with a higher level of enrichment of about ∼ 0.13 dex. The simulated bulge MZ*R agrees globally with the results from the MaNGA survey and is driven mainly by the in-situ stellar component (BB).
-
Accreted stars are found to be older and have a lower metallicity than in-situ stars, as expected, since they formed in galaxies with a lower mass than the central ones. Our results show that most of the accreted material is provided by two or three satellites at most. The main satellite contributors determine an MZR that is steeper and shows a lower level of enrichment than the bulge MZ*R.
-
DB stellar populations tend to be younger than BB stars and slightly more enriched in more massive systems, consistent with having been formed from a more chemical enriched interstellar medium in the corresponding disk components.
-
Bulges with higher facc tend to have a lower metallicity at a given bulge mass. This trend is reinforced by adding fDB. Hence, the bulge MZ*R stores relevant information about the assembly history of the bulges, which is reflected in its dispersion of the MZ*R at a given stellar mass. This trend resembles the behavior reported for the MZ*R of stellar halos (D’Souza & Bell 2018, Gonzalez-Jara in prep), where the dispersion is dominated by the most massive contributing satellite. In the case of the bulges, most of the stars are formed in situ, but the dispersion at a given bulge mass is modulated by the ex-situ stellar contribution.
These results reflect that the formation of bulges involves different formation paths that yield different chemical enrichments. However, a MZ*R is clear at place, driven mainly by the in-situ stellar population, which is the dominating component, but with a dispersion modulated by the impact of other channels of formation related to stars formed ex-situ.
Acknowledgments
We thank the anonymous referee for the constructive report, which helped to improve this paper. We thank E. Johnston and K. Jegatheesan to share their database from the MaNGA survey. We acknowledge ANID Basal Project FB210003. IM acknowledges funding by ANID (Beca Magíster Nacional, Folio 22241737). PBT acknowledges partial funding by Fondecyt-ANID 1240465/2024. This project has received funding from the European Union Horizon 2020 Research and Innovation Programme under the Marie Sklodowska-Curie grant agreement No 734374- LACEGAL. JGJ acknowledges funding by ANID (Beca Doctorado Nacional, Folio 21210846). VPM acknowledges funding by ANID (Beca Magíster Nacional, Folio 22241063). This project used the Ladgerda Cluster (Fondecyt 1200703/2020 hosted at the Institute for Astrophysics, Chile), the NLHPC (Centro de Modelamiento Matemático, Chile), Geryon clusters (Center for Astrophysics, CATA, Chile), and the Barcelona Supercomputer Center (Spain).
References
- Angeloudi, E., Falcón-Barroso, J., Huertas-Company, M., et al. 2024, Nat. Astron. [arXiv:2407.00166] [Google Scholar]
- Avila-Reese, V., & Firmani, C. 1999, ASP Conf. Ser., 163, 243 [Google Scholar]
- Baker, W. M., Maiolino, R., Belfiore, F., et al. 2023, MNRAS, 519, 1149 [Google Scholar]
- Bluck, A. F. L., Maiolino, R., Piotrowska, J. M., et al. 2020, MNRAS, 499, 230 [NASA ADS] [CrossRef] [Google Scholar]
- Bournaud, F. 2011, EAS Publ. Ser., 51, 107 [CrossRef] [EDP Sciences] [Google Scholar]
- Breda, I., Papaderos, P., & Gomes, J.-M. 2020, A&A, 640, A20 [NASA ADS] [CrossRef] [EDP Sciences] [Google Scholar]
- Camps-Fariña, A., Sánchez, S. F., Lacerda, E. A. D., et al. 2021, MNRAS, 504, 3478 [CrossRef] [Google Scholar]
- Cappellari, M., McDermid, R. M., Alatalo, K., et al. 2013, MNRAS, 432, 1862 [NASA ADS] [CrossRef] [Google Scholar]
- Casanueva-Villarreal, C., Tissera, P. B., Padilla, N., et al. 2024, A&A, 688, A183 [NASA ADS] [CrossRef] [EDP Sciences] [Google Scholar]
- Cataldi, P., Pedrosa, S. E., Tissera, P. B., et al. 2023, MNRAS, 523, 1919 [NASA ADS] [CrossRef] [Google Scholar]
- Chabrier, G., & Lenoble, R. 2023, ApJ, 944, L33 [Google Scholar]
- Cheng, Y., Giavalisco, M., Simons, R. C., et al. 2024, ApJ, 964, 94 [NASA ADS] [CrossRef] [Google Scholar]
- Chiappini, C., Matteucci, F., & Gratton, R. 1997, ApJ, 477, 765 [Google Scholar]
- Conroy, C. 2013, ARA&A, 51, 393 [NASA ADS] [CrossRef] [Google Scholar]
- Davis, M., Efstathiou, G., Frenk, C. S., & White, S. D. M. 1985, ApJ, 292, 371 [Google Scholar]
- De Rossi, M. E., Bower, R. G., Font, A. S., Schaye, J., & Theuns, T. 2017, MNRAS, 472, 3354 [Google Scholar]
- Debattista, V. P., Liddicott, D. J., Gonzalez, O. A., et al. 2023, ApJ, 946, 118 [NASA ADS] [CrossRef] [Google Scholar]
- Dolag, K., Borgani, S., Murante, G., & Springel, V. 2009, MNRAS, 399, 497 [Google Scholar]
- D’Souza, R., & Bell, E. F. 2018, MNRAS, 474, 5300 [CrossRef] [Google Scholar]
- Eggen, O. J., Lynden-Bell, D., & Sandage, A. R. 1962, ApJ, 136, 748 [NASA ADS] [CrossRef] [Google Scholar]
- Eliche-Moral, M. C., González-García, A. C., Balcells, M., et al. 2011, A&A, 533, A104 [NASA ADS] [CrossRef] [EDP Sciences] [Google Scholar]
- Fisher, D. B., & Drory, N. 2010, ApJ, 716, 942 [NASA ADS] [CrossRef] [Google Scholar]
- Fragkoudi, F., Di Matteo, P., Haywood, M., et al. 2017, A&A, 606, A47 [NASA ADS] [CrossRef] [EDP Sciences] [Google Scholar]
- Fragkoudi, F., Grand, R. J. J., Pakmor, R., et al. 2025, MNRAS, 538, 1587 [Google Scholar]
- Gallazzi, A., Charlot, S., Brinchmann, J., White, S. D. M., & Tremonti, C. A. 2005, MNRAS, 362, 41 [Google Scholar]
- Gargiulo, I. D., Monachesi, A., Gómez, F. A., et al. 2019, MNRAS, 489, 5742 [Google Scholar]
- Gargiulo, I. D., Monachesi, A., Gómez, F. A., et al. 2022, MNRAS, 512, 2537 [NASA ADS] [CrossRef] [Google Scholar]
- González Delgado, R. M., Cid Fernandes, R., García-Benito, R., et al. 2014, ApJ, 791, L16 [CrossRef] [Google Scholar]
- Gonzalez-Jara, J., Tissera, P. B., Monachesi, A., et al. 2025, A&A, 693, A282 [NASA ADS] [CrossRef] [EDP Sciences] [Google Scholar]
- Guedes, J., Callegari, S., Madau, P., & Mayer, L. 2011, ApJ, 742, 76 [NASA ADS] [CrossRef] [Google Scholar]
- Hopkins, P. F., Hernquist, L., Cox, T. J., & Kereš, D. 2008, ApJS, 175, 356 [Google Scholar]
- Hubble, E. P. 1926, ApJ, 64, 321 [Google Scholar]
- Iwamoto, K., Brachwitz, F., Nomoto, K., et al. 1999, ApJS, 125, 439 [NASA ADS] [CrossRef] [Google Scholar]
- Jegatheesan, K., Johnston, E. J., Häußler, B., & Nedkova, K. V. 2024, A&A, 684, A32 [NASA ADS] [CrossRef] [EDP Sciences] [Google Scholar]
- Jiménez, N., Tissera, P. B., & Matteucci, F. 2015, ApJ, 810, 137 [Google Scholar]
- Johnston, E. J., Häußler, B., Aragón-Salamanca, A., et al. 2017, MNRAS, 465, 2317 [Google Scholar]
- Kirby, E. N., Cohen, J. G., Guhathakurta, P., et al. 2013, ApJ, 779, 102 [Google Scholar]
- Knollmann, S. R., & Knebe, A. 2009, ApJS, 182, 608 [Google Scholar]
- Kormendy, J. 2016, Astrophys. Space Sci. Libr., 418, 431 [NASA ADS] [CrossRef] [Google Scholar]
- Kormendy, J., & Kennicutt, Jr., R. C. 2004, ARA&A, 42, 603 [NASA ADS] [CrossRef] [Google Scholar]
- Lequeux, J., Peimbert, M., Rayo, J. F., Serrano, A., & Torres-Peimbert, S. 1979, A&A, 80, 155 [Google Scholar]
- Lewis, Z. J., Andrews, B. H., Bezanson, R., et al. 2024, ApJ, 964, 59 [NASA ADS] [CrossRef] [Google Scholar]
- Lodders, K. 2019, ArXiv e-prints [arXiv:1912.00844] [Google Scholar]
- Maiolino, R., & Mannucci, F. 2019, A&ARv, 27, 3 [Google Scholar]
- Méndez-Abreu, J., Debattista, V. P., Corsini, E. M., & Aguerri, J. A. L. 2014, A&A, 572, A25 [NASA ADS] [CrossRef] [EDP Sciences] [Google Scholar]
- Mosconi, M. B., Tissera, P. B., Lambas, D. G., & Cora, S. A. 2001, MNRAS, 325, 34 [NASA ADS] [CrossRef] [Google Scholar]
- Noguchi, M. 1999, ApJ, 514, 77 [NASA ADS] [CrossRef] [Google Scholar]
- Pagel, B. E. J. 1997, Nucleosynthesis and Chemical Evolution of Galaxies [Google Scholar]
- Perez, J., Valenzuela, O., Tissera, P. B., & Michel-Dansac, L. 2013, MNRAS, 436, 259 [Google Scholar]
- Planck Collaboration XVI. 2014, A&A, 571, A16 [NASA ADS] [CrossRef] [EDP Sciences] [Google Scholar]
- Portail, M., Gerhard, O., Wegg, C., & Ness, M. 2017, MNRAS, 465, 1621 [NASA ADS] [CrossRef] [Google Scholar]
- Queiroz, A. B. A., Chiappini, C., Perez-Villegas, A., et al. 2021, A&A, 656, A156 [NASA ADS] [CrossRef] [EDP Sciences] [Google Scholar]
- Raiteri, C. M., Villata, M., & Navarro, J. F. 1996, A&A, 315, 105 [NASA ADS] [Google Scholar]
- Rodríguez, S., Garcia Lambas, D., Padilla, N. D., et al. 2022, MNRAS, 514, 6157 [CrossRef] [Google Scholar]
- Rojas-Arriagada, A., Zoccali, M., Schultheis, M., et al. 2019, A&A, 626, A16 [NASA ADS] [CrossRef] [EDP Sciences] [Google Scholar]
- Romano, D., Ferraro, F. R., Origlia, L., et al. 2023, ApJ, 951, 85 [NASA ADS] [CrossRef] [Google Scholar]
- Rosito, M. S., Tissera, P. B., Pedrosa, S. E., & Rosas-Guevara, Y. 2019, A&A, 629, A37 [NASA ADS] [CrossRef] [EDP Sciences] [Google Scholar]
- Scannapieco, C., Tissera, P. B., White, S. D. M., & Springel, V. 2005, MNRAS, 364, 552 [NASA ADS] [CrossRef] [Google Scholar]
- Scannapieco, C., Tissera, P. B., White, S. D. M., & Springel, V. 2006, MNRAS, 371, 1125 [NASA ADS] [CrossRef] [Google Scholar]
- Skillman, E. D., Kennicutt, R. C., & Hodge, P. W. 1989, ApJ, 347, 875 [NASA ADS] [CrossRef] [Google Scholar]
- Springel, V. 2005, MNRAS, 364, 1105 [Google Scholar]
- Springel, V., & Hernquist, L. 2003, MNRAS, 339, 289 [Google Scholar]
- Springel, V., White, S. D. M., Tormen, G., & Kauffmann, G. 2001, MNRAS, 328, 726 [Google Scholar]
- Stanton, T. M., Cullen, F., McLure, R. J., et al. 2024, MNRAS, 532, 3102 [Google Scholar]
- Tapia-Contreras, B., Tissera, P. B., Sillero, E., et al. 2025, A&A, 700, A69 [NASA ADS] [CrossRef] [EDP Sciences] [Google Scholar]
- Tinsley, B. M. 1980, Fund. Cosmic Phys., 5, 287 [Google Scholar]
- Tissera, P. B., Smith Castelli, A. V., & Scannapieco, C. 2006, A&A, 455, 135 [NASA ADS] [CrossRef] [EDP Sciences] [Google Scholar]
- Tissera, P. B., White, S. D. M., & Scannapieco, C. 2012, MNRAS, 420, 255 [NASA ADS] [CrossRef] [Google Scholar]
- Tissera, P. B., Bignone, L., Gonzalez-Jara, J., et al. 2025, A&A, 697, A134 [NASA ADS] [CrossRef] [EDP Sciences] [Google Scholar]
- Tremonti, C. A., Heckman, T. M., Kauffmann, G., et al. 2004, ApJ, 613, 898 [Google Scholar]
- Woosley, S. E., & Weaver, T. A. 1995, ApJS, 101, 181 [Google Scholar]
- Yu, S., Bullock, J. S., Gurvich, A. B., et al. 2023, MNRAS, 523, 6220 [NASA ADS] [CrossRef] [Google Scholar]
- Zahid, H. J., Dima, G. I., Kudritzki, R.-P., et al. 2014, ApJ, 791, 130 [NASA ADS] [CrossRef] [Google Scholar]
- Zaritsky, D., Kennicutt, R. C., & Huchra, J. P. 1994, ApJ, 420, 87 [NASA ADS] [CrossRef] [Google Scholar]
- Zenocratti, L. J., De Rossi, M. E., Theuns, T., & Lara-López, M. A. 2022, MNRAS, 512, 6164 [NASA ADS] [CrossRef] [Google Scholar]
- Zoccali, M., Vasquez, S., Gonzalez, O. A., et al. 2017, A&A, 599, A12 [NASA ADS] [CrossRef] [EDP Sciences] [Google Scholar]
The optical radius, Ropt, is defined as the one that enclosed 83 percent of the stellar mass of a galaxy.
In this work, we did not follow the origin of the gas particles that fall into the bulge (e.g. bar-driven gas inflows) but they are considered as part of the bulge-born component.
We acknowledge that numerical resolution could prevent or weaken the formation of bars, which would have an impact on the fraction of stars affected by secular evolution in our intermediate resolution run (Fragkoudi et al. 2025). Hence, the fraction of DB could be considered as a lower limit.
The estimated values are rescaled using the solar abundances from Lodders (2019).
Appendix A: Effects of the bulge/halo decomposition
The decomposition between bulge and disk relies on the binding energies at 0.5Ropt, as defined in Sec. 2.2, and the circularity. This allows us to differentiate between the inner-halo, which is less gravitationally bounded, and the bulge, which is more bounded. Nevertheless, to better quantify the effects of considering the inner-halo as a bulge, taking into account that observers usually take a fixed radius, Fig. A.1 shows the different MZ*R of the bulges, when considering all stars within a given radius as a bulge (without separating components). As shown in Fig. A.1, considering the inner halo produces a decrease of the overall metallicity of the bulge. This is expected since the halo has been shown to be formed mainly by ex-situ stars that have lower metallicities (Gonzalez-Jara et al. 2025). However, except for the low-mass end, there are no significant changes in the shape.
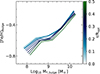 |
Fig. A.1. MZ*R of bulge, including halo up to different radii. The color-code of each line represents the corresponding radius. |
Appendix B: MZ*R and galaxy stellar mass
The dependence with the fraction of stars formed ex-situ might also be affected by the stellar mass of the galaxy itself. To test whether the dispersion at a given bulge mass also correlates with the galaxy mass, Fig. B.1 shows the MZ*R color-coded by the galaxy mass. As expected, larger bulges are found in larger galaxies. Nevertheless, the PCC analysis shows a small positive angle, highlighting that the dependence on the stellar mass of a galaxy is small and the correlation with fex − situ is stronger at a given bulge mass.
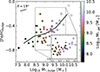 |
Fig. B.1. MZ*R for simulated bulges, color-coded by galaxy stellar mass. Similarly to Fig. 6, LOESS2D and the PCC analysis are included to quantify the trends with the third dependence. The inset figure shows the distribution without LOESS2D for the mass range of interest as comparison. |
Appendix C: Properties of the major contributor satellites
The ISM from which stellar populations are formed is expected to determine the chemical enrichment they have. In that sense, the accreted stars are born from gas that is expected to be from lower mass satellites or less enriched. Figure C.1 shows the MZ*R of the three major contributors to the bulges in the sample, at their time of infall. Additionally, the bulge MZ*R of the central galaxies at z = 0 is included (orange squares). This only considers satellites that had more than 100 stellar particles, to avoid numerical noise. As expected from Fig. 5, they tend to have lower masses and are more metal poor. Furthermore, as we move to lower stellar masses, satellites tend to infall at earlier times of the simulation. The median infall time of the satellites is  Gyr in lookback time (lower and upper numbers represent the 16th and 84th percentiles). These times are high, indicating that the stellar population formed early. This is consistent with their lower metallicities, in comparison to the global populations of the bulge at z = 0.
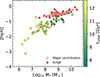 |
Fig. C.1. MZ*R for simulated bulges (orange squares) and satellites (diamonds) that contribute to bulge-accreted stellar populations. The color-code corresponds to the infall times of the contributor. |
All Figures
|
Fig. 1. Mass fraction of stellar populations contributing to bulges. Stars formed in-situ (red dots and shaded regions), accreted stars (violet dots and shaded regions), and stars formed in the disk component and subsequently incorporated into the bulge through secular evolution (yellow dots and shaded regions) are shown. The median values (dots and lines) and the 16th–84th percentiles (shaded regions) of each of the different populations are depicted. |
| In the text | |
|
Fig. 2. Cumulative contribution of satellites to accreted stellar populations, according to number of major contributors. The cumulative tracks are color-coded by the accreted fraction of the corresponding bulges. As a reference, lines at 80% and three contributors are depicted. The median trend of the contributions is included for reference (solid black line). |
| In the text | |
|
Fig. 3. MZ*R of bulges (red squares) and disks (yellow circles) of CIELO galaxies, defined by median [Fe/H]. For comparison, the CIELO galaxy MZ*R is also included (light blue line). Additionally, observational trends reported by Jegatheesan et al. (2024) for the bulges (red shaded regions) and disks (yellow shaded regions) are also included. Shaded regions are determined by the 16th–84th percentiles. |
| In the text | |
|
Fig. 4. [Fe/H] for bulge (squares) and disk (circles) components as function of galaxy stellar mass. The solid lines denote the median trends for both components (orange and yellow, respectively). Left-hand panel: Plane is color-coded by bulge-total-ratio. Right-hand panel: Median age of the corresponding components. The disk components with an excess of [Fe/H], with respect to the disk MZ*R, are highlighted. To quantify third dependences of the bulge, partial correlation coefficients analysis (PCC, Bluck et al. 2020) angles are included. |
| In the text | |
|
Fig. 5. Offset between metallicity of given stellar population and metallicity predicted by bulge MZ*R for corresponding bulge mass as [Fe/H]−[Fe/H]MZ∗R. We considered accreted (purple), disk-born (gold), and bulge-born (orange) stellar populations. Left panel: Metallicity offset as a function of the stellar mass of the bulge. Right panel: Median age of the stellar population itself. The lines correspond to the density contours at 20%, 40%, 60%, and 80% of each distribution. |
| In the text | |
|
Fig. 6. Mass-metallicity relation for the simulated bulges color-coded by accreted fraction, facc (left panel) and the accreted plus the DB fraction, fex − situ (right panel). The LOESS2D smoothing algorithm was applied to highlight the trend (Cappellari et al. 2013). The inset figure shows the distribution without LOESS2D for the mass range of interest for comparison (i.e. the actual facc, fex − situ values.). As a reference, the Milky Way bulge measurements of stellar mass (Portail et al. 2017) and median [Fe/H] (Zoccali et al. 2017) are included (black star). |
| In the text | |
|
Fig. 7. Offset of [Fe/H] with respect to the median MZ*R, Δ[Fe/H]bulges, as a function of the difference between the two formation times, T50 and T70. We show the secondary dependence of the offset on the facc (right panel), and fex − situ, defined as the sum of facc and the fraction of DB stars (left panel). The separation in fast and bursty formation history is given by a threshold in T50 – T70 ∼ 1 (red vertical line). |
| In the text | |
|
Fig. A.1. MZ*R of bulge, including halo up to different radii. The color-code of each line represents the corresponding radius. |
| In the text | |
|
Fig. B.1. MZ*R for simulated bulges, color-coded by galaxy stellar mass. Similarly to Fig. 6, LOESS2D and the PCC analysis are included to quantify the trends with the third dependence. The inset figure shows the distribution without LOESS2D for the mass range of interest as comparison. |
| In the text | |
|
Fig. C.1. MZ*R for simulated bulges (orange squares) and satellites (diamonds) that contribute to bulge-accreted stellar populations. The color-code corresponds to the infall times of the contributor. |
| In the text | |
Current usage metrics show cumulative count of Article Views (full-text article views including HTML views, PDF and ePub downloads, according to the available data) and Abstracts Views on Vision4Press platform.
Data correspond to usage on the plateform after 2015. The current usage metrics is available 48-96 hours after online publication and is updated daily on week days.
Initial download of the metrics may take a while.