Open Access
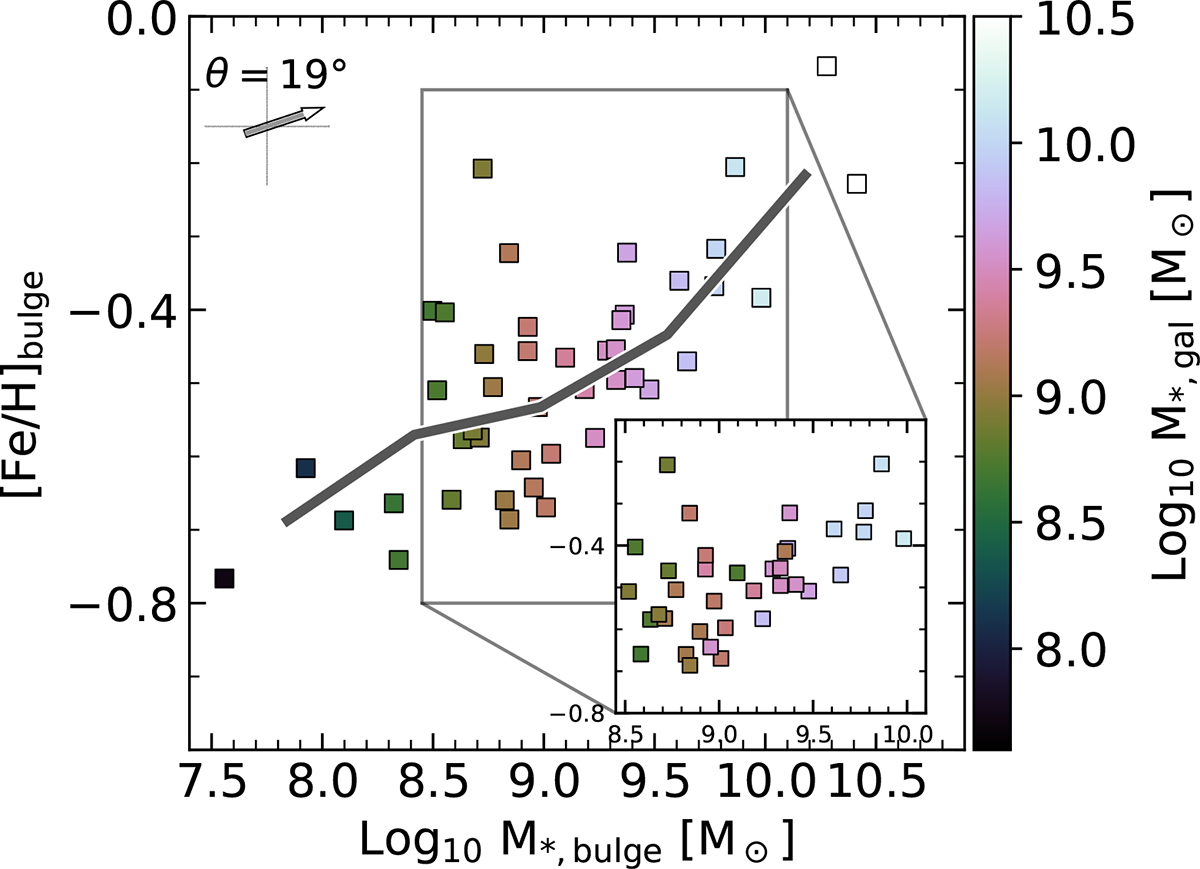
Fig. B.1.
Download original image
MZ*R for simulated bulges, color-coded by galaxy stellar mass. Similarly to Fig. 6, LOESS2D and the PCC analysis are included to quantify the trends with the third dependence. The inset figure shows the distribution without LOESS2D for the mass range of interest as comparison.
Current usage metrics show cumulative count of Article Views (full-text article views including HTML views, PDF and ePub downloads, according to the available data) and Abstracts Views on Vision4Press platform.
Data correspond to usage on the plateform after 2015. The current usage metrics is available 48-96 hours after online publication and is updated daily on week days.
Initial download of the metrics may take a while.