Fig. 1.
Download original image
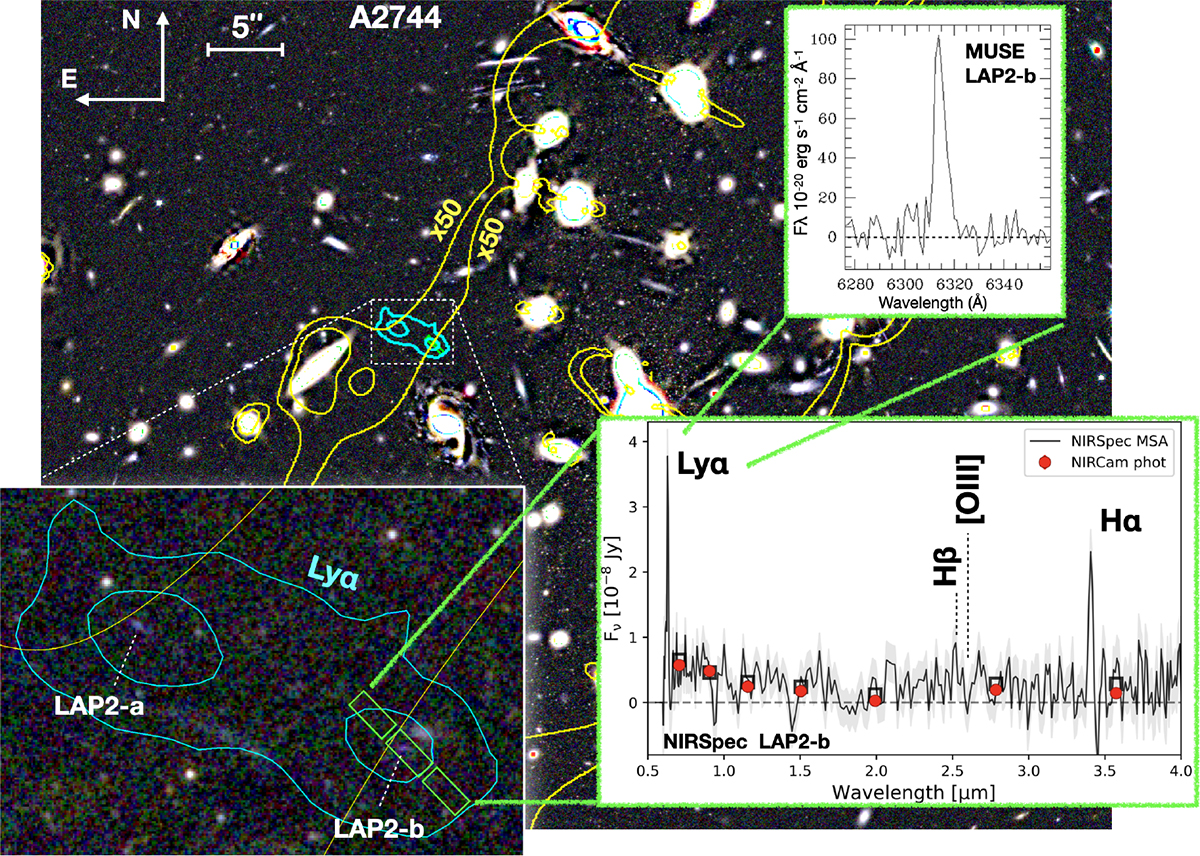
Schematic view of Lyα emitter at z = 4.189 amplified by the galaxy cluster A2744 (background color image, F090W, F150W, F200W). The yellow contours mark μ = 50 at z = 4.19 (Bergamini et al. 2023). The NIRSpec MSA pointing (green box) is shown in the bottom left inset, which zooms in on the Lyα arclet and its multiple images, dubbed LAP2-a,b (the cyan lines outline the 3 and 8σ Lyα contour from VLT/MUSE). The upper right inset shows the VLT/MUSE Lyα line emission of LAP2-b. The bottom right inset shows the NIRSpec prism spectrum and error of LAP2-b in Fν units with the fluxes inferred from the spectrum convolved with NIRCam filters (open squares) and the corresponding measured NIRCam magnitudes indicated.
Current usage metrics show cumulative count of Article Views (full-text article views including HTML views, PDF and ePub downloads, according to the available data) and Abstracts Views on Vision4Press platform.
Data correspond to usage on the plateform after 2015. The current usage metrics is available 48-96 hours after online publication and is updated daily on week days.
Initial download of the metrics may take a while.