| Issue |
A&A
Volume 705, January 2026
|
|
|---|---|---|
| Article Number | L12 | |
| Number of page(s) | 4 | |
| Section | Letters to the Editor | |
| DOI | https://doi.org/10.1051/0004-6361/202557153 | |
| Published online | 12 January 2026 | |
Letter to the Editor
A pristine, star-forming complex at z = 4.19★
1
INAF – OAS, Osservatorio di Astrofisica e Scienza dello Spazio di Bologna via Gobetti 93/3 I-40129 Bologna, Italy
2
Max-Planck-Institut für Astrophysik Karl-Schwarzschild-Str. 1 D-85748 Garching, Germany
3
INAF – Osservatorio Astronomico di Roma, Via Frascati 33 00078 Monteporzio Catone Rome, Italy
4
Department of Physics & Astronomy, University College London London WC1E 6BT, UK
5
Department of Astronomy, Oskar Klein Centre, Stockholm University, AlbaNova University Centre SE-106 91 Stockholm, Sweden
6
Department of Physics and Astronomy, University of California, Los Angeles 430 Portola Plaza Los Angeles CA 90095, USA
7
Dipartimento di Fisica, Università degli Studi di Milano Via Celoria 16 I-20133 Milano, Italy
8
INAF – IASF Milano via A. Corti 12 I-20133 Milano, Italy
9
Dipartimento di Fisica e Scienze della Terra, Università degli Studi di Ferrara Via Saragat 1 I-44122 Ferrara, Italy
★★ Corresponding author: This email address is being protected from spambots. You need JavaScript enabled to view it.
Received:
8
September
2025
Accepted:
21
December
2025
Abstract
We report the discovery of a faint (M1700 ≃ −12.2), oxygen-deficient, strongly lensed ionizing source – dubbed Lensed And Pristine 2 (LAP2) – at a spectroscopic redshift of z = 4.19. LAP2 appears to be isolated and lies very close to the caustic produced by the lensing galaxy cluster Abell 2744. It was observed with the James Webb Space Telescope (JWST) NIRSpec MSA in prism mode as part of the UNCOVER program. The NIRSpec spectrum reveals prominent Lyα (7.1σ), clear Hα (6.2σ), tentative Hβ (≃2.8σ) emissions and no detectable [O/III]λλ4959,5007 (∼7 times fainter than Hα). The inferred [O III] 2σ upper limit corresponds to an R3 index < 0.85 (assuming the Hα/Hβ = 2.86 case B recombination ratio), which, under high-ionization conditions, implies a metallicity of Z < 6 × 10⁻³ Z⊙. The combination of faint ultraviolet luminosity, a large rest-frame Hα equivalent width (≃650 Å), and an extremely compact size (< 10 pc) suggests that LAP2 is being caught in an early, pristine formation phase consistent with an instantaneous-burst scenario, with an estimated stellar mass of at most a few ×104 M⊙. Deep VLT/MUSE observations further reveal copious Lyα emission forming an arclet that straddles the critical line. LAP2 joins the rare class of extremely metal-poor star-forming complexes that the JWST has started to unveil at redshifts 3–7, and it provides a glimpse into a still very poorly explored low-luminosity regime.
Key words: stars: Population III / galaxies: distances and redshifts / galaxies: formation / galaxies: high-redshift
Based on observations collected with the James Webb Space Telescope (JWST) and Hubble Space Telescope (HST). These observations are associated with JWST GO n.1908 (PI E. Vanzella), GTO n.1208 (CANUCS, PI Willott), and GTO n.1176 (PEARLS, PI Windhorst).
© The Authors 2026
 Open Access article, published by EDP Sciences, under the terms of the Creative Commons Attribution License (https://creativecommons.org/licenses/by/4.0), which permits unrestricted use, distribution, and reproduction in any medium, provided the original work is properly cited.
This article is published in open access under the Subscribe to Open model. This email address is being protected from spambots. You need JavaScript enabled to view it. to support open access publication.
1. Introduction
The direct observation of PopulationIII (Pop III) star formation remains a challenging task (e.g., Katz et al. 2023) and typically requires the aid of gravitational lensing, which boosts the intrinsically faint continuum and line emission (e.g., Zackrisson et al. 2015). Lensing also enhances spatial contrast, making it possible to distinguish individual – and potentially isolated – stellar pockets. Depending on the magnification, this enables investigations on scales of tens of parsecs, and in some cases down to parsec-sized regions (e.g., Vanzella et al. 2020; Adamo et al. 2024; Messa et al. 2025). The advent of the JWST facility, with its greatly improved angular resolution and extended wavelength coverage into the near-infrared, has opened the way for targeted searches for Pop III galaxy candidates (e.g., Trussler et al. 2023; Fujimoto et al. 2025) and, potentially, for their direct detection. The recent discovery of two oxygen-deficient, high-redshift sources – AMORE-B at z = 5.725 (Morishita et al. 2025) and CR3 at z = 3.19 (Cai et al. 2025) – adds to the previously identified lensed and pristine object at z = 6.63 (LAP1), initially serendipitously discovered with VLT/MUSE (Vanzella et al. 2020) and subsequently followed up with the JWST (Vanzella et al. 2023; Nakajima et al. 2025). While the detailed physical properties of these systems are still under investigation, the apparent deficit of oxygen lines in the rest-frame optical suggests gas-phase metallicities below 1% of the solar value, and re-opens the issue of prolonged pristine star formation down to relatively low redshift: z ∼ 3 − 5 (e.g., Liu & Bromm 2020; Hegde & Furlanetto 2025). Finding very low-metallicity, low-mass sources at these redshifts is important because they provide a rare glimpse of galaxies under conditions similar to those of the early Universe, helping us understand how the first generations of stars (Pop III/II) enriched the cosmos with heavier elements (Venditti et al. 2023; Maio et al. 2016; see also Rusta et al. 2025). At the same time, they allow us to probe metallicity at very low stellar masses, which is particularly relevant for constraining the mass–metallicity relation down to unexplored mass limits (Maiolino & Mannucci 2019). The rarity of these objects in deep-field surveys underscores the importance of strong gravitational lensing to bring them within reach of current instrumentation (e.g., Zackrisson et al. 2015).
In this work, we present JWST/NIRSpec MSA observations of an extremely faint ionizing source, first identified with VLT/MUSE as an arclet straddling the critical line at z = 4.19 (1.5 Gyr after the Big Bang) and included among the spectroscopically confirmed multiple images in the Bergamini et al. (2023) lens model. The system lies behind the Hubble Frontier Fields cluster Abell 2744 (Lotz et al. 2017), which strongly lenses the source and reveals its oxygen-deficient nature at z = 4.19. We assumed a flat cosmology with ΩM = 0.3, ΩΛ = 0.7, and H0 = 70 km s−1 Mpc−1. Magnitudes are in the AB system (Oke & Gunn 1983), mAB = 23.9 − 2.5log(fν/μJy).
2. JWST observations and analysis
The galaxy cluster A2744 has been widely observed with JWST/NIRCam, NIRSpec, and NIRISS since Cycle 1, including GLASS ERS (Treu et al. 2022), UNCOVER (Price et al. 2025), and MEGASCIENCE (Suess et al. 2024). We used JWST/NIRSpec GO 2561 data (PI: Labbe; UNCOVER; Price et al. 2025) targeting LAP2-b with the MSA prism/CLEAR (Figure 1). We analyzed the reduced MAST products (obsid: 300843376), which provide flux- and wavelength-calibrated 2D spectra with associated errors, for a total exposure time of 15 756 s. We extracted the spectrum at the Lyα, Hα, and continuum positions using a three-pixel window (Figure 2). Line fitting was performed with specutils/astropy1: Hα was modeled with a Gaussian (centroid, full width half maximum – FWHM – and flux), while for Hβ the centroid and width were fixed to those of Hα; the continuum was fit with a second-degree polynomial. The Hα-based redshift is z = 4.189 ± 0.03 (Table 1). NIRCam imaging from the above programs was retrieved from the Dawn JWST Archive (DJA)2. We adopted F090W as rest-UV (≃1700 Å) and F277W as rest-optical (≃5300 Å). As shown in Figure 1, LAP2 is split into two magnified images, LAP2-a and LAP2-b, with μ ∼ 58 and ∼50, respectively (Bergamini et al. 2023). We focused on LAP2-b, the NIRSpec MSA target; all values in Table 1 refer to it. Figure 2 shows the 1D and 2D spectra and NIRCam imaging. While the NIRSpec-inferred continuum and the NIRCam photometry agree within the uncertainties overall, the long wavelength NIRCam magnitudes appear slightly fainter than NIRSpec. LAP2-b is faint, lies on elevated cluster background, and is close to a potential contaminant. This likely explains the small offset between the NIRCam and NIRSpec magnitudes redward of 2 μm. However, the [O/III]λλ4959,5007/Hα ratio discussed below is computed including the continuum in the line fitting, so the Hα flux is negligibly affected by contamination, leaving our main conclusions unchanged. Forthcoming NIRSpec observations of LAP2-a (the counter-image) will further mitigate this issue. None of the lines (Lyα, Hβ, Hα) are spectrally resolved at prism resolution (≃4000, 4000, and 3000 km s−1). A tentative Hβ is detected at ∼2.8σ. The Lyα detection recalls that from MUSE, though differences in angular resolution, potential slit losses (Bhagwat et al. 2025), and proximity to the NIRSpec cutoff prevent direct flux comparison. No other rest-frame UV/optical lines are detected up to λ ≃ 9600 Å, in particular no He IIλ1640, consistent with the MUSE spectrum extending to 1800 Å. The He IIλ1640 line has a 2σ EW limit of 80 Å (from the MUSE flux limit and NIRCam F090W continuum). This limit remains too weak to place meaningful constraints on the Population III signature (Nakajima & Maiolino 2022). Deeper NIRSpec/IFU prism data are allocated in Cycle 4 (prog. 7677), covering Lyα to Hα.
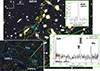 |
Fig. 1. Schematic view of Lyα emitter at z = 4.189 amplified by the galaxy cluster A2744 (background color image, F090W, F150W, F200W). The yellow contours mark μ = 50 at z = 4.19 (Bergamini et al. 2023). The NIRSpec MSA pointing (green box) is shown in the bottom left inset, which zooms in on the Lyα arclet and its multiple images, dubbed LAP2-a,b (the cyan lines outline the 3 and 8σ Lyα contour from VLT/MUSE). The upper right inset shows the VLT/MUSE Lyα line emission of LAP2-b. The bottom right inset shows the NIRSpec prism spectrum and error of LAP2-b in Fν units with the fluxes inferred from the spectrum convolved with NIRCam filters (open squares) and the corresponding measured NIRCam magnitudes indicated. |
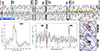 |
Fig. 2. Overview of JWST/NIRSpec MSA pointing on LAP2. The 2D spectrum is shown on the top with the more relevant lines indicated, along with the area used for the extraction of the spectrum (dashed horizontal lines). The yellow shaded area marks contamination signal arising from a nearby source, and the blue shaded area on the left marks the wavelength coverage of VLT/MUSE. The bottom left and middle insets show the line and continuum fitting (dashed colored curves). The light gray shaded area indicates the flux uncertainties, while the light red area in the bottom middle panel indicates the expected wavelength of the [O III] doublet. Both the 1D and 2D spectra reveal the absence of oxygen emission. The bottom right inset shows a zoomed-in view (1.9″ × 1.6″) of the F090W band of LAP2-b targeted with MSA (outlined with the black boxes). The blue contours mark the VLT/MUSE Lyα at 3 and 8 sigma, along with the locus of μ = 50 (red line). |
Observed and derived properties of LAP2-b.
3. Results
We summarize the main results in the following.
(1) Metallicity. The spectrum shows a very faint continuum with clear Lyα and Hα emission lines, consistent with the VLT/MUSE Lyα measured at 10σ (Table 1). The most remarkable spectral feature is the non-detection of [O/III]λλ4959,5007, down to a 2σ upper limit of 0.50 × 10⁻¹⁹ erg s−1 cm−2. This implies an R3 index ≲0.85 (assuming the intrinsic Hα/Hβ ratio of 2.86 from case B recombination, Osterbrock & Ferland 2006), which, assuming the R3-index calibration for high-z systems by Sanders et al. (2024), corresponds to a metallicity of Z < 0.006 Z⊙ (or 12+log(O/H) < 6.5) at 2σ. Even considering more conservative R3 calibrations (e.g., Nakajima et al. 2022), the expected metallicity remains within ∼1% Z⊙ (Figure 3)3.
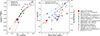 |
Fig. 3. Oxygen abundance of LAP2-b, as function of its R3 index (left panel, 2σ limit is reported) and its stellar mass (right panel). Additional measurements of low-metallicity sources at z > 3 from the literature are reported (Vanzella et al. 2023; Morishita et al. 2024; Chemerynska et al. 2024; Mowla et al. 2024; Tripodi et al. 2025; Vanzella et al. 2024; Hsiao et al. 2025; Curti et al. 2025; Cullen et al. 2025; Willott et al. 2025; Maiolino et al. 2025; Nakajima et al. 2025; Cai et al. 2025; Morishita et al. 2025). Samples plotted with empty markers have their metallicity estimated from the direct Te method, as opposed to the ones derived from strong line ratios (filled markers). The two most common R3-to-Z calibrations used in high-z studies as well as the conversion based on the BPASS models used in Morishita et al. (2025) (dotted black line), are shown in the left panel (see legend). Two recent mass-metallicity relations derived from high-z samples (blue line: Curti et al. 2024; black line: Morishita et al. 2024) are shown in the right panel; the mass ranges used to derive the relations are shown as the solid portion of the line. |
(2) Morphology. From the F090W-band image shown in Figure 2, LAP2-b appears point-like. We conservatively adopted the FWHM measured in the F090W band (≃30 mas) as an estimate of its size. The tangential magnification of ≃20 ± 2 corresponds to less than 10 pc along the tangential direction. A more detailed morphological analysis will be performed on the NIRCam images in combination with forthcoming NIRSpec/IFU observations of both mirrored images (LAP2-a and LAP2-b).
(3) Stellar mass and age. The F090W magnitude of LAP2-b is mF090W = mUV = 29.69 ± 0.09 (probing λ ≃ 1700 Å rest-frame), and with a magnification factor of μ = 50 ± 5 it translates into an intrinsic mUV = 33.8 or ultraviolet magnitude of MUV ≃ −12.2 at z = 4.189. The resulting equivalent width of the Hα line is 647 Å when inferred from the Hα line flux and the F277W magnitude (or 600 Å from the spectrum itself, though the continuum is poorly constrained; see Table 1). The ionizing photon production efficiency – the LyC production rate per monochromatic UV luminosity (Schaerer et al. 2016) – is relatively high, Log10(ξion) = 25.13, and is a lower limit if the escaping ionizing radiation is not zero (fesc > 0, neglecting dust attenuation correction, as copious Lyα emission suggests). Given the compact size of the star complex, an instantaneous burst is a plausible star formation history. Using STARBURST99 models (Leitherer et al. 2014) with a bursty scenario and the lowest available metallicity ( = 1/20 Z⊙), the observed UV luminosity and the Hα equivalent width imply an age < 10 Myr and a stellar mass ≃2 × 10⁴ M⊙. A similar range of stellar mass for the same interval of ages is inferred from the rest-frame optical wavelength (F277W, sampling the λ ≃ 5000 Å, Table 1), (1.2 − 5.0)×104 M⊙. This scenario also implies a significantly high specific star formation rate of ≳100 Gyr−1, corresponding to the inverse of the estimated age. It is worth noting that the observed line ratio, Hα/Hβ, is currently not constrained due to low S/R of Hβ detection (≃2.8σ), and the Lyα/Hα (either from NIRSpec or in combination with MUSE) needs a dedicated NIRSpec IFU observation that fully captures the Lyα and Hα emission regions (prog. 7677). Finally, LAP2-b appears rather isolated based on the current spectroscopic redshift catalogs. Using the DR4 spectroscopic redshift catalog released by the UNCOVER collaboration (Suess et al. 2024), we searched for galaxies within 10 cMpc of LAP2-b. We found only one galaxy with zspec = 4.181, located 5.3 comoving Mpc from LAP2-b.
4. Final remarks
The VLT/MUSE blind spectroscopy led to the discovery of an extremely faint star source at z = 4.19 straddling the critical line (Richard et al. 2021), appearing as two mirrored images: LAP2-a and LAP2-b. The large magnification factors of the two images imply that LAP2 is a tiny and faint star complex with an estimated size of < 10 pc, intrinsic ultraviolet luminosity MUV = −12.2, and a stellar mass of a few tens of thousands of solar masses. The JWST/NIRSpec spectrum shows a clear deficit of [O/III]λλ4959,5007, ∼7 times fainter than Hα corresponding to 2σ limit of Z < 0.006 Z⊙. This places LAP2-b among the most metal poor objects known to date (Figure 3) and re-opens the issue of prolonged pristine star formation down to relatively low redshifts: z ∼ 3 − 5 (e.g., Liu & Bromm 2020). These sources provide an initial glimpse of galaxies under conditions similar to those of the early Universe, occupying a rarely explored regime of low stellar mass. The system is scheduled to be observed with NIRSpec/IFU in prism mode (Prog. 7677) for a total of 17.4 hours. The resulting 2D maps will enable a direct comparison with the VLT/MUSE IFU Lyα detection, an independent and deeper check of the oxygen deficit in both multiple images, and, by combining them with the data presented here, the possibility of placing more stringent limits on oxygen and other metal lines. These observations will push LAP2-b into a previously unexplored regime of very low-metallicity systems.
Acknowledgments
We thank the anonymous referees for the careful reading and constructive comments. This work is based on observations made with the NASA/ESA/CSA James Webb Space Telescope (JWST) and Hubble Space Telescope (HST). These observations are associated with JWST GO program n.2561 (PI I. Labbé). We acknowledge financial support through grants PRIN-MIUR 2017WSCC32 and 2020SKSTHZ. We thank S.Fujimoto for providing the data for GLIMPSE-16043. EV and MM acknowledge financial support through grants INAF GO Grant 2024 “Mapping Star Cluster Feedback in a Galaxy 450 Myr after the Big Bang” and the European Union – NextGenerationEU within PRIN 2022 project n.20229YBSAN - Globular clusters in cosmological simulations and lensed fields: from their birth to the present epoch. This research has used NASA’s Astrophysics Data System and SAOImageDS9, developed by Smithsonian Astrophysical Observatory. Additionally, this work made use of the following open-source packages for Python, and we are thankful to the developers of these: Matplotlib (Hunter 2007), Numpy (van der Walt et al. 2011). EV thanks Martini Urban Ristobar for the stimulating ideas and internet connection.
References
- Adamo, A., Bradley, L. D., Vanzella, E., et al. 2024, Nature, 632, 513 [NASA ADS] [CrossRef] [Google Scholar]
- Asplund, M., Grevesse, N., Sauval, A. J., & Scott, P. 2009, ARA&A, 47, 481 [NASA ADS] [CrossRef] [Google Scholar]
- Bergamini, P., Acebron, A., Grillo, C., et al. 2023, ApJ, 952, 84 [NASA ADS] [CrossRef] [Google Scholar]
- Bhagwat, A., Napolitano, L., Pentericci, L., Ciardi, B., & Costa, T. 2025, MNRAS, 542, 128 [Google Scholar]
- Cai, S., Li, M., Cai, Z., et al. 2025, ApJ, 993, L52 [Google Scholar]
- Chemerynska, I., Atek, H., Dayal, P., et al. 2024, ApJ, 976, L15 [NASA ADS] [CrossRef] [Google Scholar]
- Cullen, F., Carnall, A. C., Scholte, D., et al. 2025, MNRAS, 540, 2176 [Google Scholar]
- Curti, M., Maiolino, R., Curtis-Lake, E., et al. 2024, A&A, 684, A75 [NASA ADS] [CrossRef] [EDP Sciences] [Google Scholar]
- Curti, M., Witstok, J., Jakobsen, P., et al. 2025, A&A, 697, A89 [Google Scholar]
- Fujimoto, S., Naidu, R. P., Chisholm, J., et al. 2025, ApJ, 989, 46 [Google Scholar]
- Hegde, S., & Furlanetto, S. R. 2025, Open J. Astrophys., 8, 147 [Google Scholar]
- Hsiao, T. Y. Y., Sun, F., Lin, X., et al. 2025, arXiv e-prints [arXiv:2505.03873] [Google Scholar]
- Hunter, J. D. 2007, Comput. Sci. Eng., 9, 90 [NASA ADS] [CrossRef] [Google Scholar]
- Katz, H., Kimm, T., Ellis, R. S., Devriendt, J., & Slyz, A. 2023, MNRAS, 524, 351 [CrossRef] [Google Scholar]
- Leitherer, C., Ekström, S., Meynet, G., et al. 2014, ApJS, 212, 14 [Google Scholar]
- Liu, B., & Bromm, V. 2020, MNRAS, 497, 2839 [NASA ADS] [CrossRef] [Google Scholar]
- Lotz, J. M., Koekemoer, A., Coe, D., et al. 2017, ApJ, 837, 97 [Google Scholar]
- Maio, U., Petkova, M., De Lucia, G., & Borgani, S. 2016, MNRAS, 460, 3733 [NASA ADS] [CrossRef] [Google Scholar]
- Maiolino, R., & Mannucci, F. 2019, A&ARv, 27, 3 [Google Scholar]
- Maiolino, R., Uebler, H., D’Eugenio, F., et al. 2025, arXiv e-prints [arXiv:2505.22567] [Google Scholar]
- Messa, M., Vanzella, E., Loiacono, F., et al. 2025, A&A, 694, A59 [NASA ADS] [CrossRef] [EDP Sciences] [Google Scholar]
- Morishita, T., Stiavelli, M., Grillo, C., et al. 2024, ApJ, 971, 43 [NASA ADS] [CrossRef] [Google Scholar]
- Morishita, T., Liu, Z., Stiavelli, M., et al. 2025, arXiv e-prints [arXiv:2507.10521] [Google Scholar]
- Mowla, L., Iyer, K., Asada, Y., et al. 2024, Nature, 636, 332 [Google Scholar]
- Nakajima, K., & Maiolino, R. 2022, MNRAS, 513, 5134 [NASA ADS] [CrossRef] [Google Scholar]
- Nakajima, K., Ouchi, M., Xu, Y., et al. 2022, ApJS, 262, 3 [CrossRef] [Google Scholar]
- Nakajima, K., Ouchi, M., Harikane, Y., et al. 2025, arXiv e-prints [arXiv:2506.11846] [Google Scholar]
- Oke, J. B., & Gunn, J. E. 1983, ApJ, 266, 713 [NASA ADS] [CrossRef] [Google Scholar]
- Osterbrock, D. E., & Ferland, G. J. 2006, Astrophysics of Gaseous Nebulae and Active Galactic Nuclei (University Science Books) [Google Scholar]
- Price, S. H., Bezanson, R., Labbe, I., et al. 2025, ApJ, 982, 51 [Google Scholar]
- Richard, J., Claeyssens, A., Lagattuta, D., et al. 2021, A&A, 646, A83 [EDP Sciences] [Google Scholar]
- Rusta, E., Salvadori, S., Gelli, V., et al. 2025, ApJ, 989, L32 [Google Scholar]
- Sanders, R. L., Shapley, A. E., Topping, M. W., Reddy, N. A., & Brammer, G. B. 2024, ApJ, 962, 24 [NASA ADS] [CrossRef] [Google Scholar]
- Schaerer, D., Izotov, Y. I., Verhamme, A., et al. 2016, A&A, 591, L8 [NASA ADS] [CrossRef] [EDP Sciences] [Google Scholar]
- Suess, K. A., Weaver, J. R., Price, S. H., et al. 2024, ApJ, 976, 101 [Google Scholar]
- Treu, T., Roberts-Borsani, G., Bradac, M., et al. 2022, ApJ, 935, 110 [NASA ADS] [CrossRef] [Google Scholar]
- Tripodi, R., Martis, N., Markov, V., et al. 2025, Nat. Commun., 16, 9830 [Google Scholar]
- Trussler, J. A. A., Conselice, C. J., Adams, N. J., et al. 2023, MNRAS, 525, 5328 [NASA ADS] [CrossRef] [Google Scholar]
- van der Walt, S., Colbert, S. C., & Varoquaux, G. 2011, Comput. Sci. Eng., 13, 22 [Google Scholar]
- Vanzella, E., Meneghetti, M., Caminha, G. B., et al. 2020, MNRAS, 494, L81 [Google Scholar]
- Vanzella, E., Loiacono, F., Bergamini, P., et al. 2023, A&A, 678, A173 [NASA ADS] [CrossRef] [EDP Sciences] [Google Scholar]
- Vanzella, E., Loiacono, F., Messa, M., et al. 2024, A&A, 691, A251 [NASA ADS] [CrossRef] [EDP Sciences] [Google Scholar]
- Venditti, A., Graziani, L., Schneider, R., et al. 2023, MNRAS, 522, 3809 [NASA ADS] [CrossRef] [Google Scholar]
- Willott, C. J., Asada, Y., Iyer, K. G., et al. 2025, ApJ, 988, 26 [Google Scholar]
- Zackrisson, E., González, J., Eriksson, S., et al. 2015, MNRAS, 449, 3057 [NASA ADS] [CrossRef] [Google Scholar]
The derived R3 limit would correspond to Z ≳ 0.9 Z⊙ if considering the high-metallicity branch of the calibrations; in this case, we would expect detectable [S II]λλ 6717,6731/Hα ≈ 0.4 and [O II]λ 3727/Hβ ≈ 3, which we do not observe in the spectrum, rejecting this case.
All Tables
All Figures
|
Fig. 1. Schematic view of Lyα emitter at z = 4.189 amplified by the galaxy cluster A2744 (background color image, F090W, F150W, F200W). The yellow contours mark μ = 50 at z = 4.19 (Bergamini et al. 2023). The NIRSpec MSA pointing (green box) is shown in the bottom left inset, which zooms in on the Lyα arclet and its multiple images, dubbed LAP2-a,b (the cyan lines outline the 3 and 8σ Lyα contour from VLT/MUSE). The upper right inset shows the VLT/MUSE Lyα line emission of LAP2-b. The bottom right inset shows the NIRSpec prism spectrum and error of LAP2-b in Fν units with the fluxes inferred from the spectrum convolved with NIRCam filters (open squares) and the corresponding measured NIRCam magnitudes indicated. |
| In the text | |
|
Fig. 2. Overview of JWST/NIRSpec MSA pointing on LAP2. The 2D spectrum is shown on the top with the more relevant lines indicated, along with the area used for the extraction of the spectrum (dashed horizontal lines). The yellow shaded area marks contamination signal arising from a nearby source, and the blue shaded area on the left marks the wavelength coverage of VLT/MUSE. The bottom left and middle insets show the line and continuum fitting (dashed colored curves). The light gray shaded area indicates the flux uncertainties, while the light red area in the bottom middle panel indicates the expected wavelength of the [O III] doublet. Both the 1D and 2D spectra reveal the absence of oxygen emission. The bottom right inset shows a zoomed-in view (1.9″ × 1.6″) of the F090W band of LAP2-b targeted with MSA (outlined with the black boxes). The blue contours mark the VLT/MUSE Lyα at 3 and 8 sigma, along with the locus of μ = 50 (red line). |
| In the text | |
|
Fig. 3. Oxygen abundance of LAP2-b, as function of its R3 index (left panel, 2σ limit is reported) and its stellar mass (right panel). Additional measurements of low-metallicity sources at z > 3 from the literature are reported (Vanzella et al. 2023; Morishita et al. 2024; Chemerynska et al. 2024; Mowla et al. 2024; Tripodi et al. 2025; Vanzella et al. 2024; Hsiao et al. 2025; Curti et al. 2025; Cullen et al. 2025; Willott et al. 2025; Maiolino et al. 2025; Nakajima et al. 2025; Cai et al. 2025; Morishita et al. 2025). Samples plotted with empty markers have their metallicity estimated from the direct Te method, as opposed to the ones derived from strong line ratios (filled markers). The two most common R3-to-Z calibrations used in high-z studies as well as the conversion based on the BPASS models used in Morishita et al. (2025) (dotted black line), are shown in the left panel (see legend). Two recent mass-metallicity relations derived from high-z samples (blue line: Curti et al. 2024; black line: Morishita et al. 2024) are shown in the right panel; the mass ranges used to derive the relations are shown as the solid portion of the line. |
| In the text | |
Current usage metrics show cumulative count of Article Views (full-text article views including HTML views, PDF and ePub downloads, according to the available data) and Abstracts Views on Vision4Press platform.
Data correspond to usage on the plateform after 2015. The current usage metrics is available 48-96 hours after online publication and is updated daily on week days.
Initial download of the metrics may take a while.