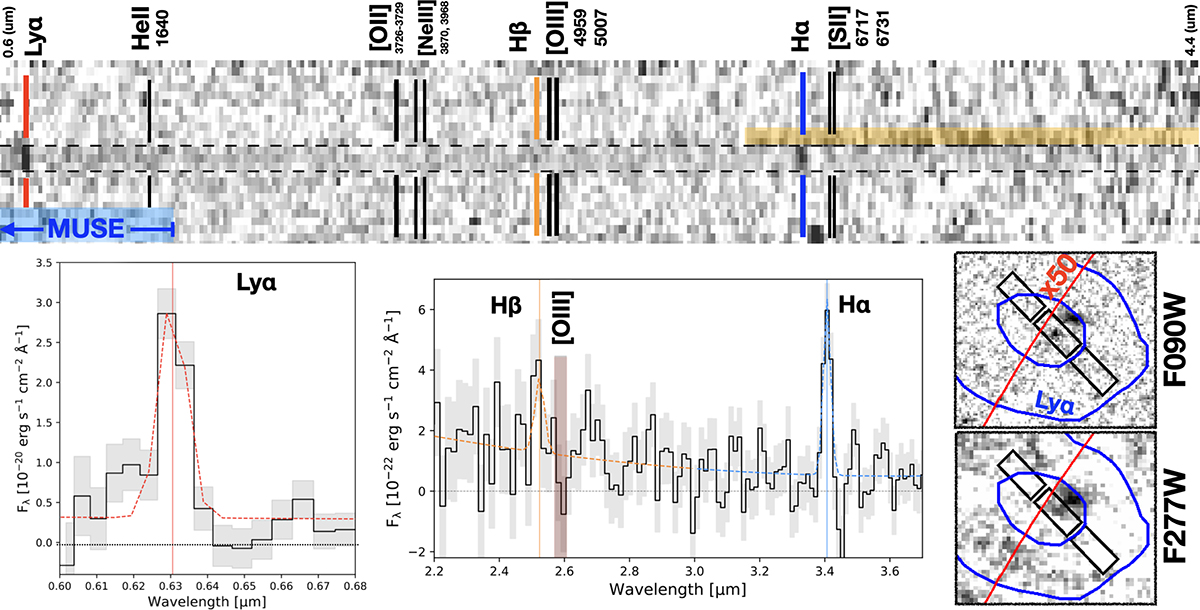
Fig. 2.
Download original image
Overview of JWST/NIRSpec MSA pointing on LAP2. The 2D spectrum is shown on the top with the more relevant lines indicated, along with the area used for the extraction of the spectrum (dashed horizontal lines). The yellow shaded area marks contamination signal arising from a nearby source, and the blue shaded area on the left marks the wavelength coverage of VLT/MUSE. The bottom left and middle insets show the line and continuum fitting (dashed colored curves). The light gray shaded area indicates the flux uncertainties, while the light red area in the bottom middle panel indicates the expected wavelength of the [O III] doublet. Both the 1D and 2D spectra reveal the absence of oxygen emission. The bottom right inset shows a zoomed-in view (1.9″ × 1.6″) of the F090W band of LAP2-b targeted with MSA (outlined with the black boxes). The blue contours mark the VLT/MUSE Lyα at 3 and 8 sigma, along with the locus of μ = 50 (red line).
Current usage metrics show cumulative count of Article Views (full-text article views including HTML views, PDF and ePub downloads, according to the available data) and Abstracts Views on Vision4Press platform.
Data correspond to usage on the plateform after 2015. The current usage metrics is available 48-96 hours after online publication and is updated daily on week days.
Initial download of the metrics may take a while.