Fig. 10
Download original image
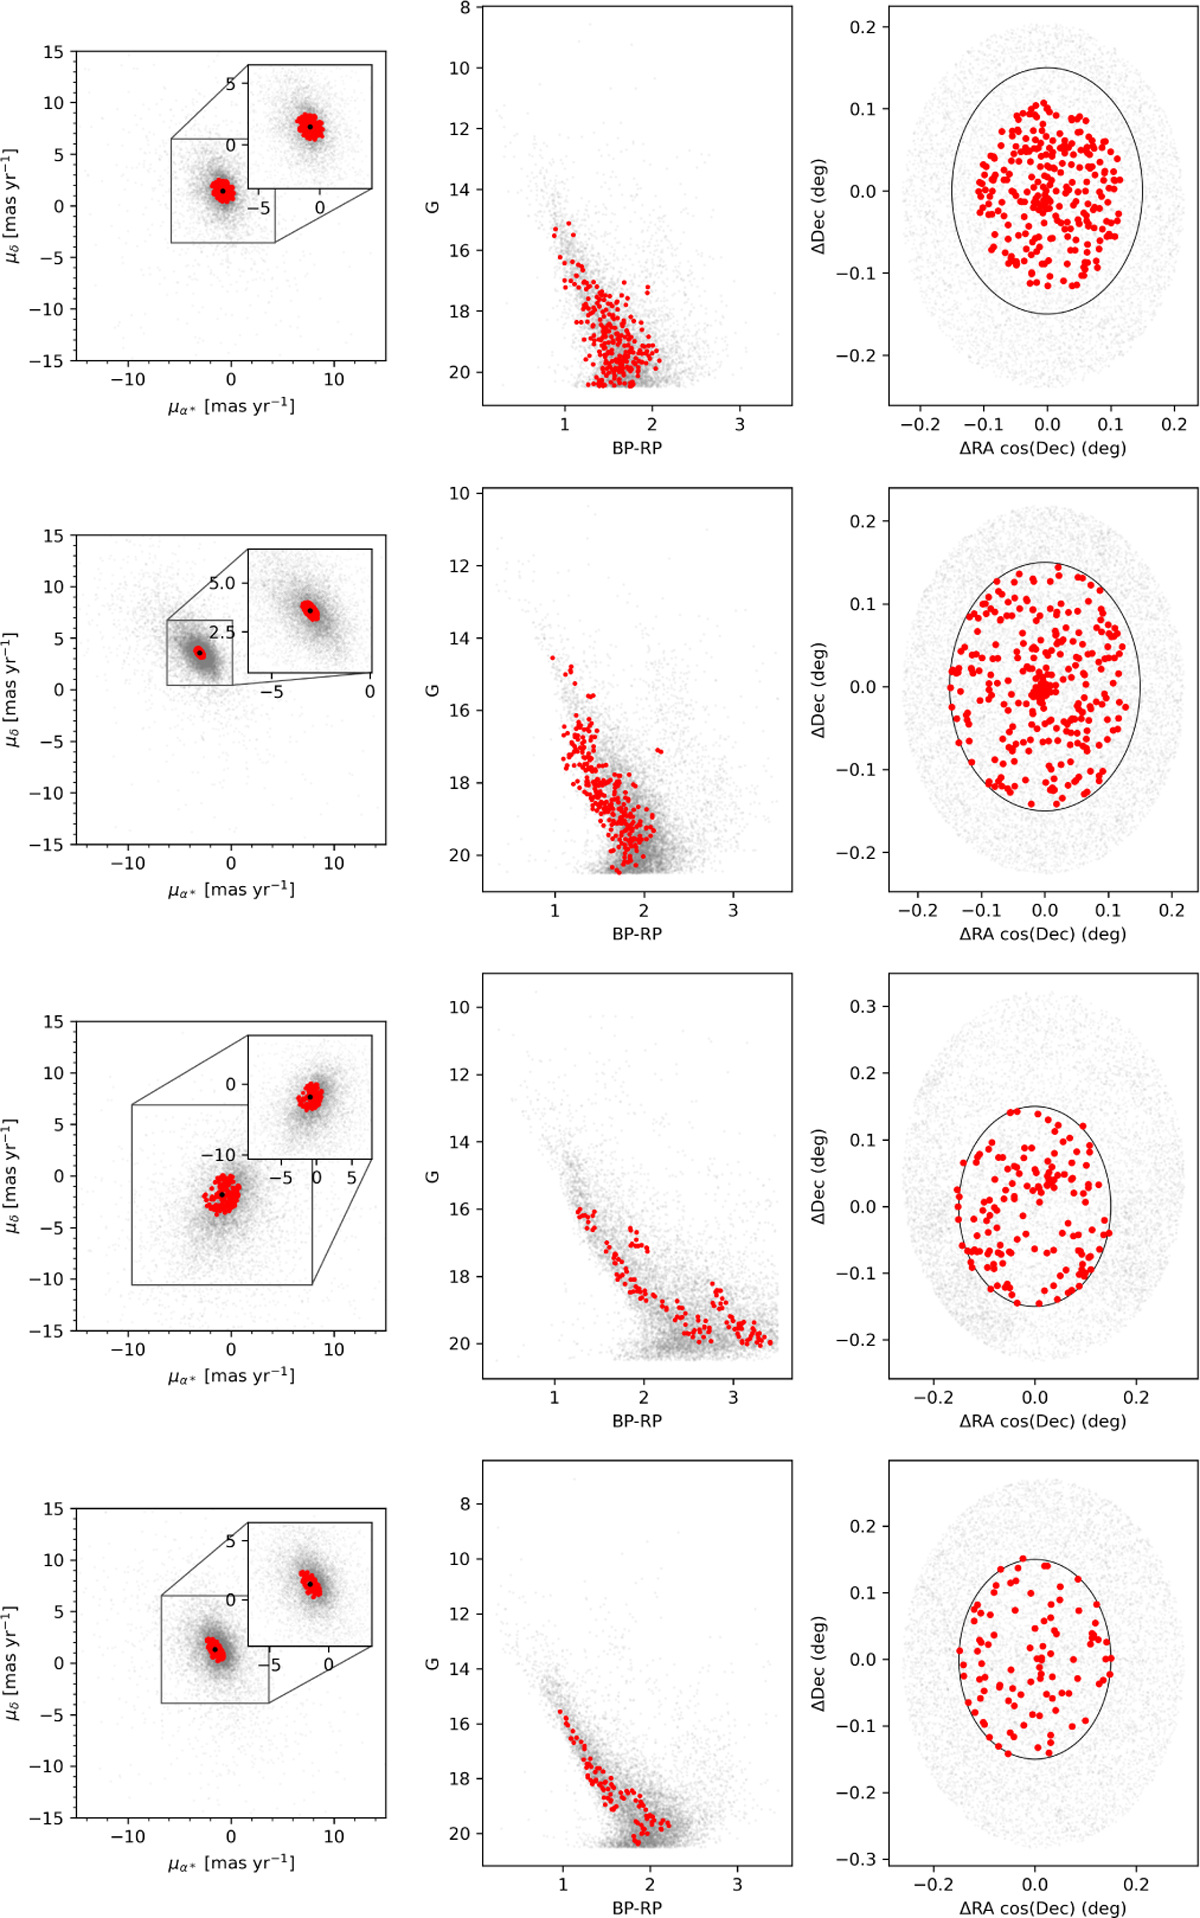
Diagnostic plots for a candidate stellar cluster identified in the VVVX survey using Gaia data. Left: proper motion diagram (µα cos δ vs. µδ, in mas yr−1), where gray points represent all stars within 0.4 degrees and 0.5 mas of the cluster center. A red dot where the inset line is projected indicate HDBSCAN-selected members. The inset highlights stars within 2σ of the proper motion centroid in black dot. Middle: Gaia color–magnitude diagram (BP–RP vs. G), showing HDBSCAN-selected cluster members (red) tracing a distinct main sequence, albeit contaminated among field stars (gray). Right: spatial distribution in ∆RAcos (Dec) and ∆Dec (degrees). HDBSCAN selected Cluster members (red) are concentrated within 0.3 degrees of the center, while field stars (gray) appear scattered. We indicate the cluster overdensity, centered on the black circle with a radius of 0.15°, which is clearly distinct from the surrounding field. Each panel corresponds to one of the clusters shown in Fig. 9: the first panel shows the cluster centered on tile 0602 (panel a), the second panel on tile e1022 panel b, and the third and fourth panels on tiles e0965 (panel c) and e1047 (panel d), respectively.
Current usage metrics show cumulative count of Article Views (full-text article views including HTML views, PDF and ePub downloads, according to the available data) and Abstracts Views on Vision4Press platform.
Data correspond to usage on the plateform after 2015. The current usage metrics is available 48-96 hours after online publication and is updated daily on week days.
Initial download of the metrics may take a while.