Fig. 12
Download original image
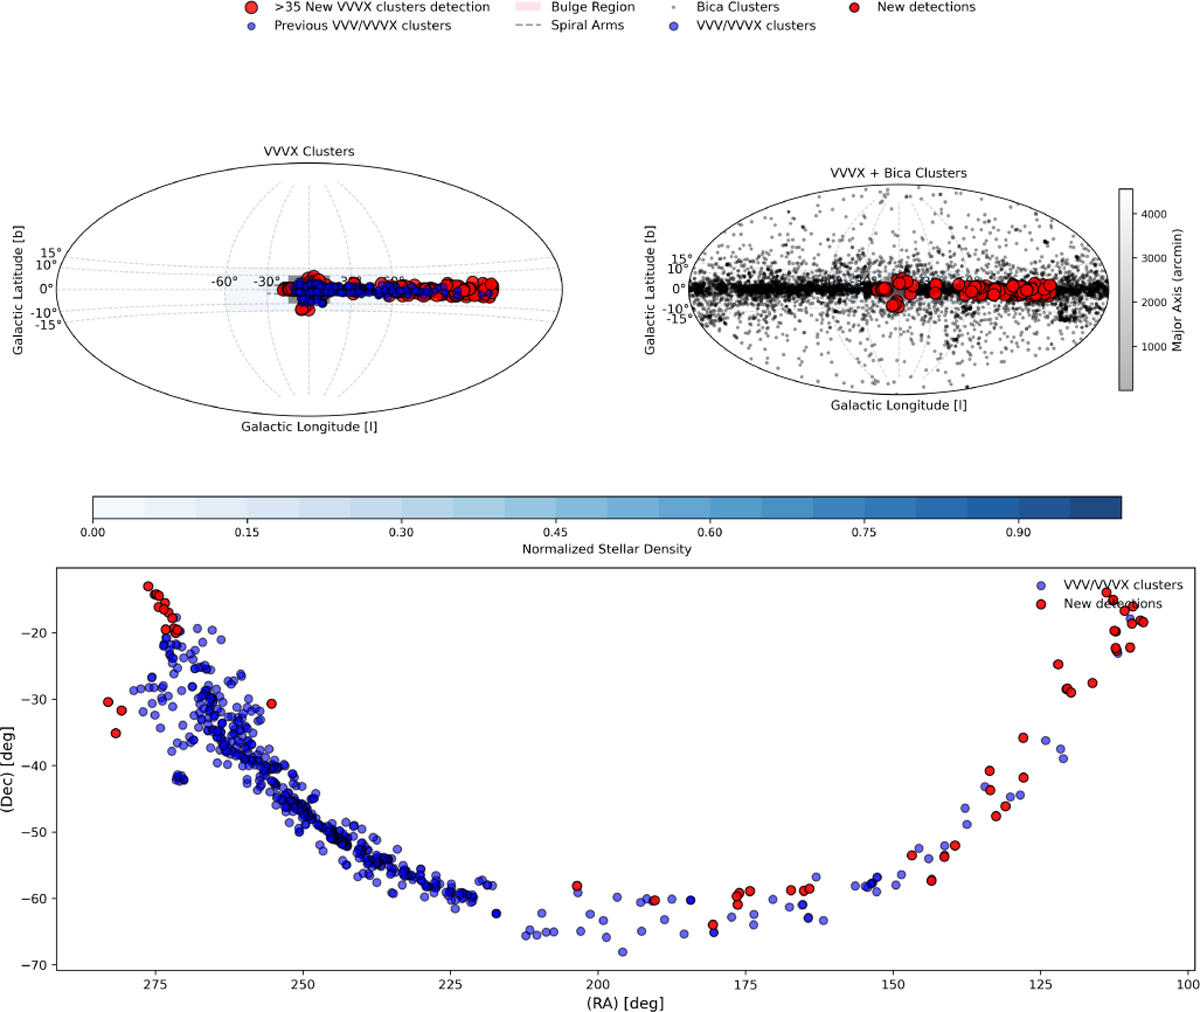
Top left: spatial distribution of newly detected VVVX clusters (red) overplotted with previously detected VVV and VVVX clusters (blue). Top right: same plot, but showing only our new detections and known clusters from Bica et al. (2018b, gray). Bottom: our new detections (red) overplotted with previously known VVV and VVVX clusters in equatorial coordinates (RA, Dec).
Current usage metrics show cumulative count of Article Views (full-text article views including HTML views, PDF and ePub downloads, according to the available data) and Abstracts Views on Vision4Press platform.
Data correspond to usage on the plateform after 2015. The current usage metrics is available 48-96 hours after online publication and is updated daily on week days.
Initial download of the metrics may take a while.