Open Access
Fig. B.5
Download original image
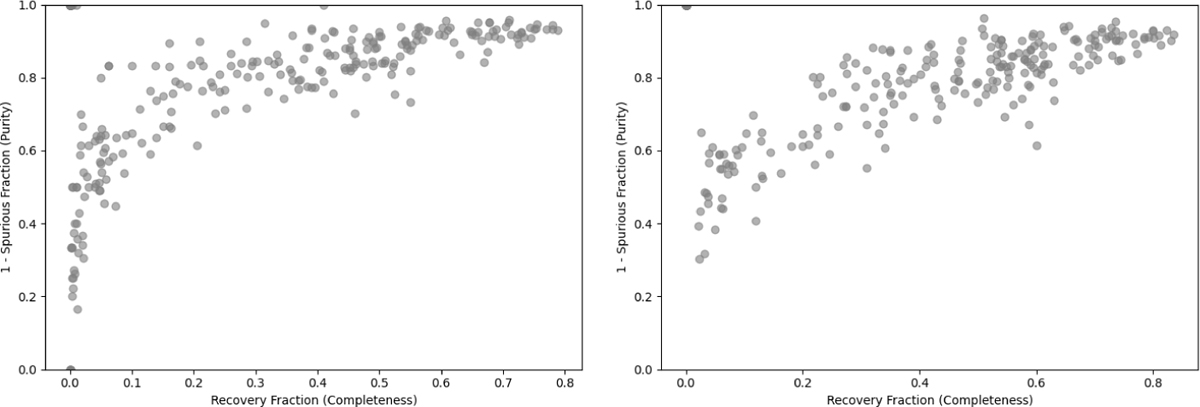
Scatter plot showing the tradeoff between completeness (recovery fraction) and purity (1 - spurious fraction) for all injected clusters, comparing the default (left) and tuned (right) configurations. The relationship illustrates the balance between maximizing true detections and minimizing false positives.
Current usage metrics show cumulative count of Article Views (full-text article views including HTML views, PDF and ePub downloads, according to the available data) and Abstracts Views on Vision4Press platform.
Data correspond to usage on the plateform after 2015. The current usage metrics is available 48-96 hours after online publication and is updated daily on week days.
Initial download of the metrics may take a while.