Fig. 2
Download original image
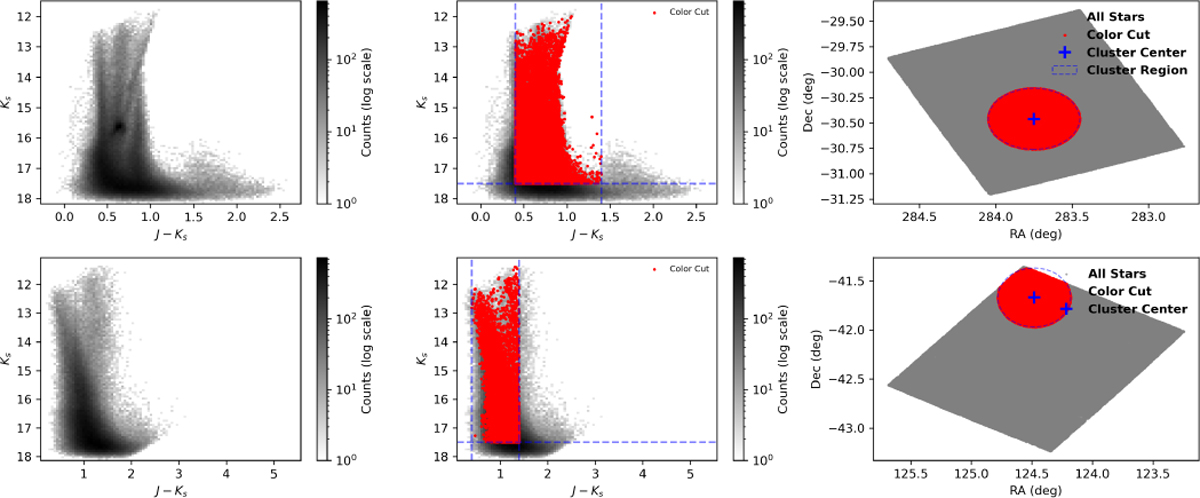
Color-magnitude and spatial distributions of stars in tiles b0411 (M54), upper panel, and e0621 (Pismis 2), bottom panel. Left panels: 2D histograms showing all sources in (J − Ks) versus Ks diagram. Middle panels: sources passing color-magnitude selection (0.4 < J − Ks < 1.4, Ks < 17.5) are overlaid in red, with the selection boundaries marked by dashed blue lines. Right panels: spatial distributions in RA versus Dec, where all stars are shown in gray, and color-selected sources are shown in red. Blue crosses mark the cluster centers, and dashed blue circles indicate a 0.3◦ radius.
Current usage metrics show cumulative count of Article Views (full-text article views including HTML views, PDF and ePub downloads, according to the available data) and Abstracts Views on Vision4Press platform.
Data correspond to usage on the plateform after 2015. The current usage metrics is available 48-96 hours after online publication and is updated daily on week days.
Initial download of the metrics may take a while.