Open Access
Fig. 5
Download original image
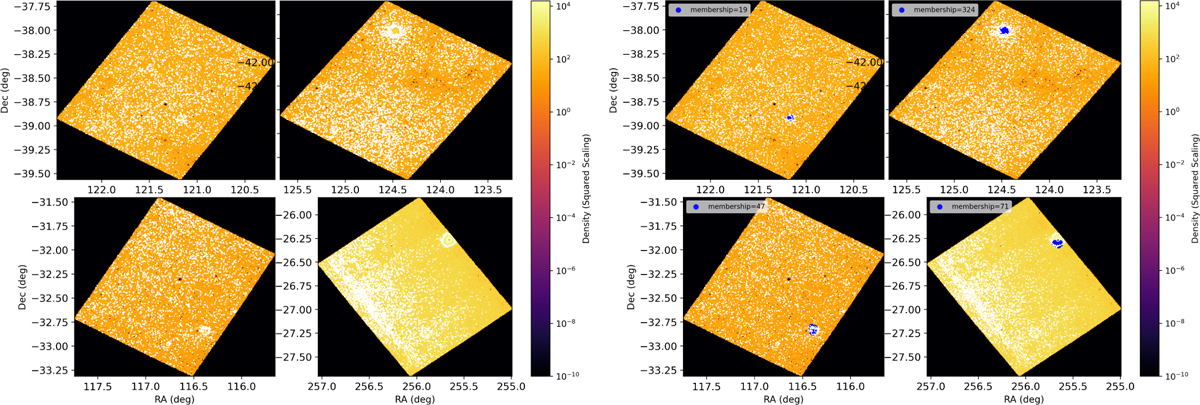
Same as Fig. 4 but for CWNU 4193 (e0618), Pismis 2 (e0621), Haffner 15 (e0613), and M 19 (e0503). The maps show the stellar-density distributions in each VVVX tile, with the identified cluster members overplotted. The legend reports the number of recovered members for each cluster.
Current usage metrics show cumulative count of Article Views (full-text article views including HTML views, PDF and ePub downloads, according to the available data) and Abstracts Views on Vision4Press platform.
Data correspond to usage on the plateform after 2015. The current usage metrics is available 48-96 hours after online publication and is updated daily on week days.
Initial download of the metrics may take a while.