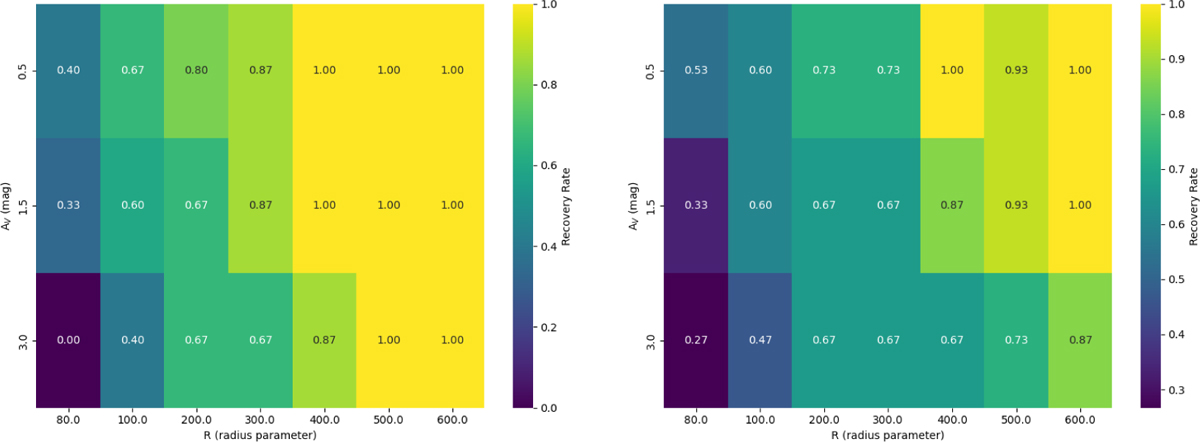
Fig. 8
Download original image
Two-dimensional completeness surface (heat map) showing mean recovery rate as function of cluster radius (R) and extinction (AV; left-right panel default and tuned configuration). For the default configuration, completeness decreases toward smaller radii and higher extinctions, and it becomes extreme at R=80, where it drops to 0. In contrast, for tuned settings, completeness gradually increases toward larger radii and lower extinction. The plot also shows the parameter space where the pipeline remains reliable.
Current usage metrics show cumulative count of Article Views (full-text article views including HTML views, PDF and ePub downloads, according to the available data) and Abstracts Views on Vision4Press platform.
Data correspond to usage on the plateform after 2015. The current usage metrics is available 48-96 hours after online publication and is updated daily on week days.
Initial download of the metrics may take a while.