Open Access
Fig. 9
Download original image
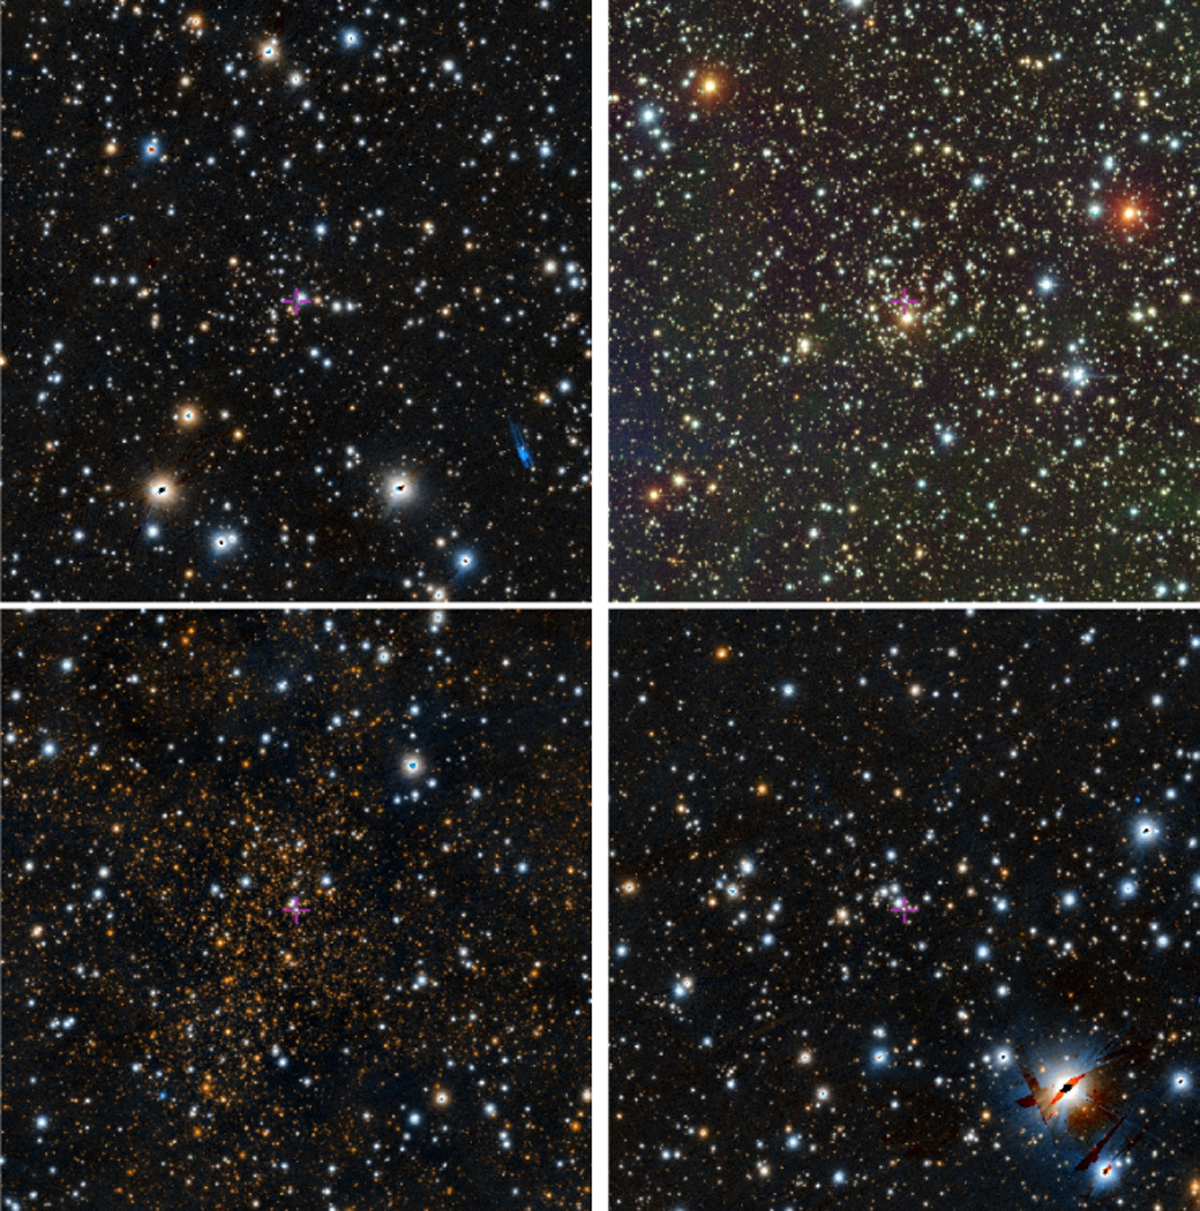
Composite images of subset of newly detected cluster candidates. Upper row: clusters from tiles e0602 and e1022. Lower row: clusters from tiles e0965 and e1047. Panels a and c are based on Pan-STARRS images, and panels b and d use DECam Plane Survey (DECaPS) DR1 color composites constructed from the g, r, and z bands.
Current usage metrics show cumulative count of Article Views (full-text article views including HTML views, PDF and ePub downloads, according to the available data) and Abstracts Views on Vision4Press platform.
Data correspond to usage on the plateform after 2015. The current usage metrics is available 48-96 hours after online publication and is updated daily on week days.
Initial download of the metrics may take a while.