Fig. 3.
Download original image
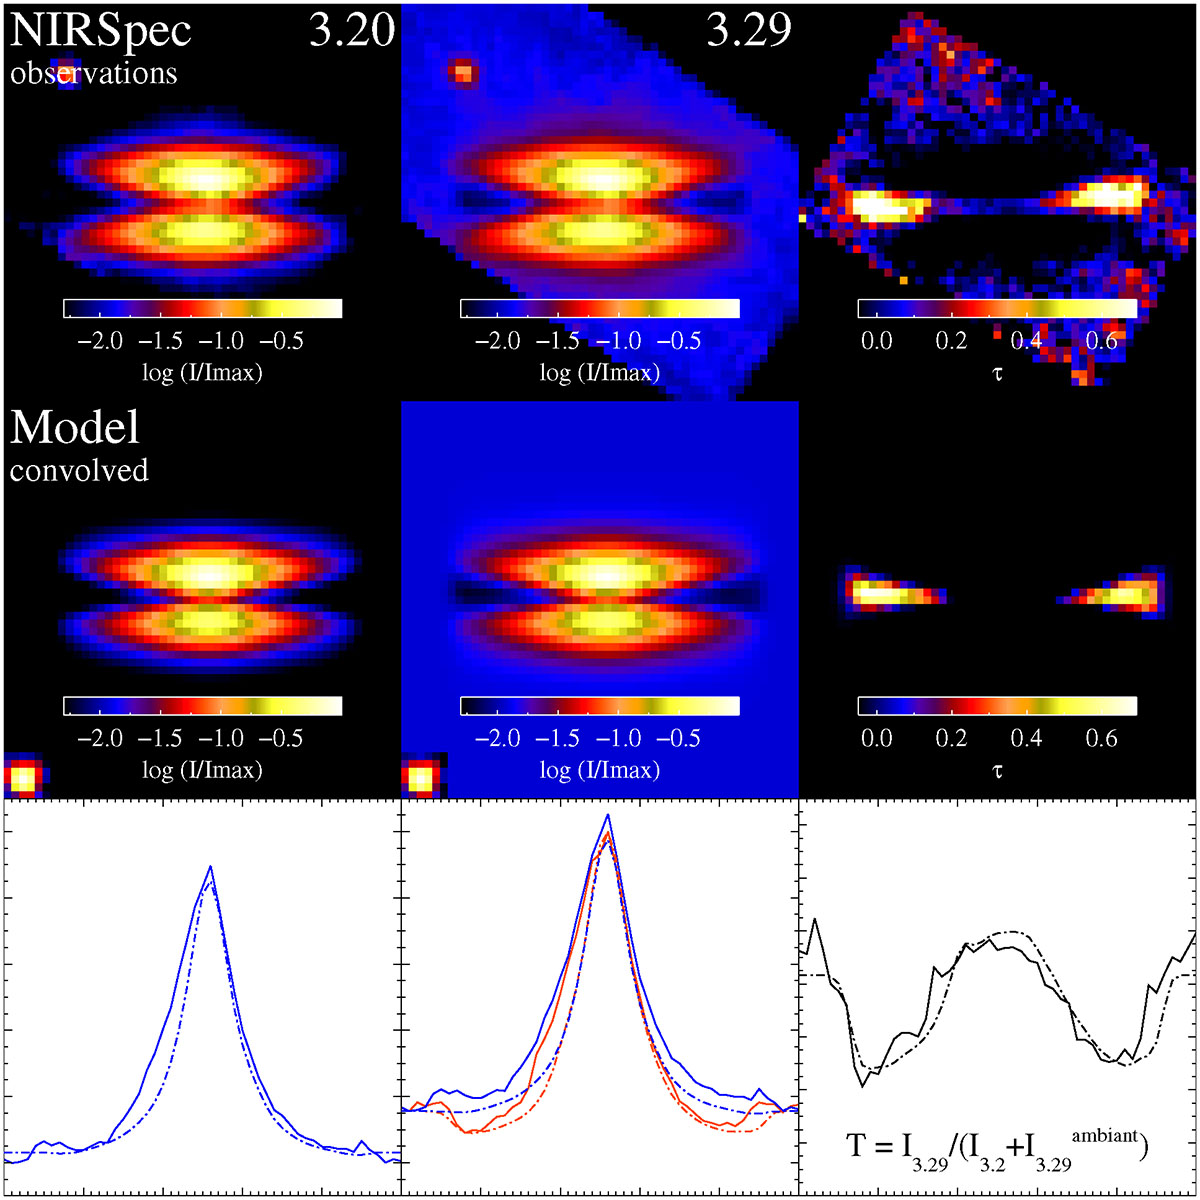
Observations and models of disc emission and silhouette. Left and centre columns show the emission at 3.2 μm (I3.2, no astro-PAH background) and 3.29 μm (I3.29, peak astro-PAH background), respectively. The right column shows the extincted optical depth ![]() . The bottom row shows profile cuts along the midplane comparing observations (solid lines) and models (dashed lines). Blue lines (left) correspond to the 3.2 μm cut. Red lines (centre) are the 3.29 μm cut. Blue cuts include an offset corresponding to the astro-PAH background contribution, i.e. the expected cut if no silhouette extinction were present. Black lines (right) show
. The bottom row shows profile cuts along the midplane comparing observations (solid lines) and models (dashed lines). Blue lines (left) correspond to the 3.2 μm cut. Red lines (centre) are the 3.29 μm cut. Blue cuts include an offset corresponding to the astro-PAH background contribution, i.e. the expected cut if no silhouette extinction were present. Black lines (right) show ![]() ) along the midplane cut in both the model and observations.
) along the midplane cut in both the model and observations.
Current usage metrics show cumulative count of Article Views (full-text article views including HTML views, PDF and ePub downloads, according to the available data) and Abstracts Views on Vision4Press platform.
Data correspond to usage on the plateform after 2015. The current usage metrics is available 48-96 hours after online publication and is updated daily on week days.
Initial download of the metrics may take a while.