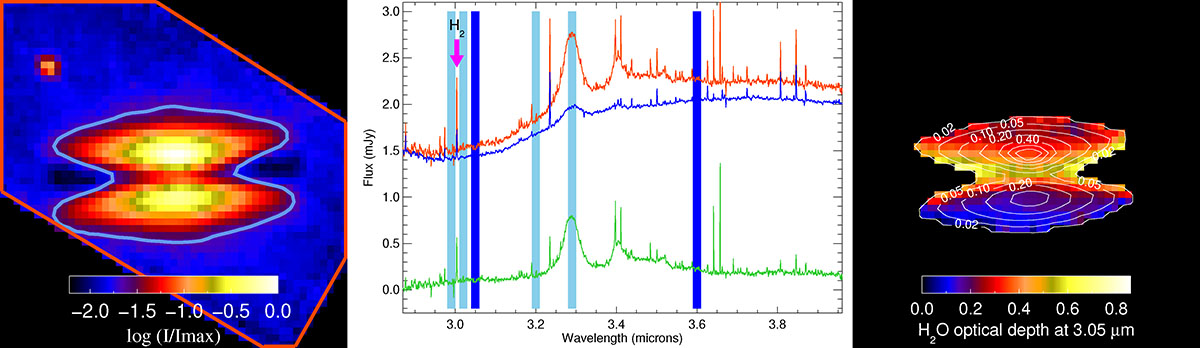
Fig. B.1.
Download original image
External ambient field extraction and icy grains water ice extinction map. Left: Footprints used to extract (i) the disc emission (blue contour) and (ii) the flux in the entire image (red contour). The ambient field contribution is derived by subtracting one from the other. Middle: Spectrum of the entire field (red), spectrum within the disc footprint (blue), and difference spectrum to show the ambient emission field (green). The vertical filled regions show the bandpasses of the tailored filters, which were used to make the images shown in Fig.2 (light blue, at (2.99 and 3.02), 3.2, and 3.29 μm). For the H2 image at 3.004 μm, only the three channels in which the emission line contributes were used (around the position shown with the magenta arrow), whereas the emission line-free filter, termed ‘2.99 μm’, makes use of the channels on both sides of the line position to estimate the disc emission around this H2 line. Right: Optical depth image (−ln(I3.05/I3.6)) made using the two filters shown in dark blue in the middle panel and constructed using channels around 3.05 and 3.6 μm. The optical depth image clearly shows the presence of water ice extinction (OH stretching mode absorption at 3.05 μm) at high vertical altitude in the disc, especially in the upper lobe, requiring icy grains to model the disc radiative transfer.
Current usage metrics show cumulative count of Article Views (full-text article views including HTML views, PDF and ePub downloads, according to the available data) and Abstracts Views on Vision4Press platform.
Data correspond to usage on the plateform after 2015. The current usage metrics is available 48-96 hours after online publication and is updated daily on week days.
Initial download of the metrics may take a while.