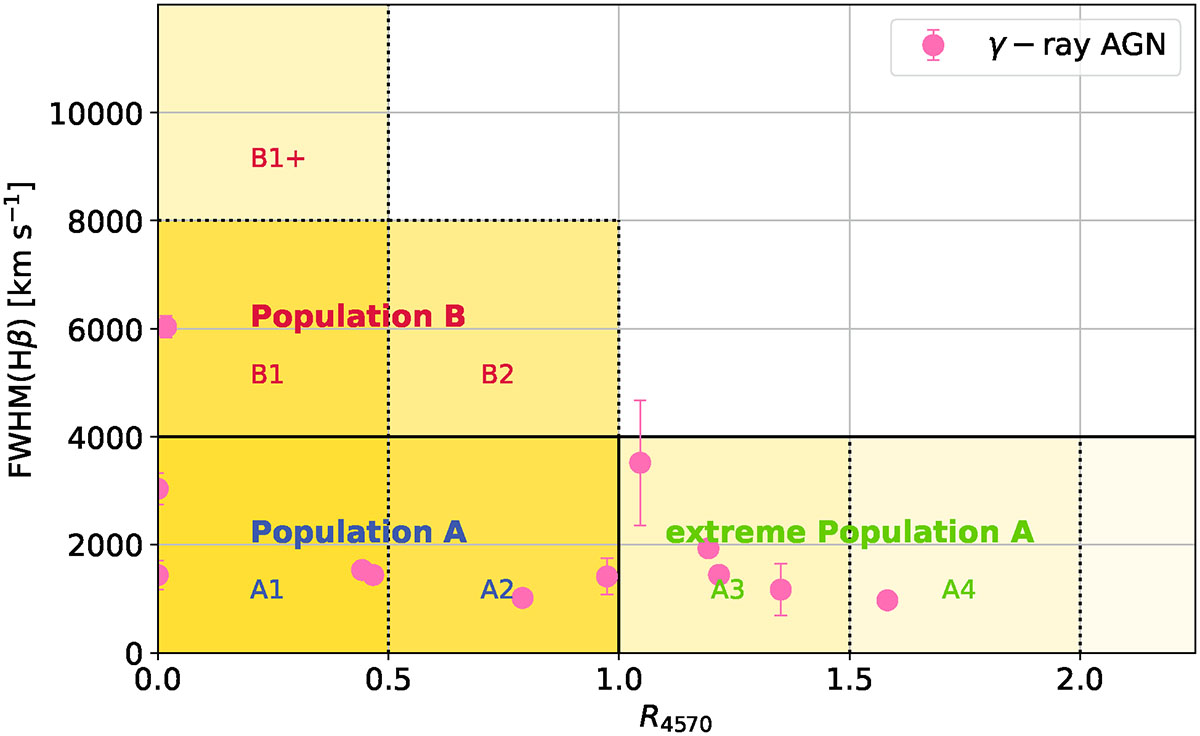
Fig. 2.
Download original image
FWHM(Hβbroad)–R4570 plane that defines the quasar MS. Pop. A and B are shown, together with their finer subdivisions. Shaded regions indicate the areas populated by quasars, with the color intensity representing the source density in each region. The pink points represent the objects in the current sample for which the FWHM(Hβbroad) and R4570 were measured.
Current usage metrics show cumulative count of Article Views (full-text article views including HTML views, PDF and ePub downloads, according to the available data) and Abstracts Views on Vision4Press platform.
Data correspond to usage on the plateform after 2015. The current usage metrics is available 48-96 hours after online publication and is updated daily on week days.
Initial download of the metrics may take a while.