| Issue |
A&A
Volume 705, January 2026
|
|
|---|---|---|
| Article Number | A122 | |
| Number of page(s) | 14 | |
| Section | Extragalactic astronomy | |
| DOI | https://doi.org/10.1051/0004-6361/202557187 | |
| Published online | 13 January 2026 | |
Revised optical classification of a sample of gamma-ray-emitting active galactic nuclei with GTC and VLT
1
Universitá degli studi dell’Insubria Via Valleggio 11 Como 22100, Italy
2
Osservatorio Astronomico di Brera, Istituto Nazionale di Astrofisica (INAF) Via E. Bianchi 46 Merate (LC) 23807, Italy
3
European Southern Observatory (ESO) Alonso de Córdova 3107 Vitacura Santiago, Chile
4
Department of Physics and Astronomy, Texas Tech University Box 41051 Lubbock 79409-1051 TX, USA
5
Osservatorio Astronomico di Padova, Istituto Nazionale di Astrofisica (INAF) Vicolo dell’Osservatorio 5 35122 Padova, Italy
6
Dipartimento di Fisica e Astronomia “G. Galilei”, Università degli studi di Padova Vicolo dell’Osservatorio 3 Padova 35122, Italy
7
Jeremiah Horrocks Institute, University of Central Lancashire Preston PR1 2HE, UK
8
Osservatorio Astronomico di Cagliari, Istituto Nazionale di Astrofisica (INAF) Via della Scienza 5 09047 Selargius, Italy
9
CFisUC, Departamento de Física, Universidade de Coimbra 3004-516 Coimbra, Portugal
10
Dept. of Physics & Astronomy and Dept. of Computer Science, University College London Gower Street London WC1E 6BT, UK
11
Dipartimento di Fisica, Università di Roma Tor Vergata Via della Ricerca Scientifica 1 00133 Roma, Italy
12
Instituto de Estudios Astrofísicos, Facultad de Ingeniería y Ciencias, Universidad Diego Portales Avenida Ejercito Libertador 441 Santiago, Chile
★ Corresponding author: This email address is being protected from spambots. You need JavaScript enabled to view it.
Received:
10
September
2025
Accepted:
15
November
2025
Abstract
We report the results of the optical follow-up of a sample of γ-ray-emitting active galactic nuclei (AGNs). New high-quality optical spectra were obtained using the Gran Telescopio Canarias with the Optical System for Imaging and low-Intermediate-Resolution Integrated Spectroscopy and the European Southern Observatory’s Very Large Telescope Unit Telescope 1 with the FOcal Reducer and low dispersion Spectrograph 2. From the analysis of these spectra, we confirmed the previous narrow-line Seyfert 1 (NLS1) classification for four objects and discovered two new NLS1s, bringing the total number of optically confirmed γ-NLS1s to 26. We also identified two ambiguous cases between NLS1 and intermediate Seyfert (IS), three ISs, one broad-line Seyfert 1, and one Seyfert 2. Based on the new spectra, we calculated black hole masses ranging from 106.25 to 109.32 M⊙ and Eddington ratios spanning 0.05 to 2.07. This reclassification provides support for the scenario in which AGNs with relatively low black hole masses are capable of launching powerful relativistic jets and contributes to our broader understanding of γ-ray-emitting AGNs.
Key words: galaxies: active / galaxies: jets / quasars: emission lines / galaxies: Seyfert
© The Authors 2026
 Open Access article, published by EDP Sciences, under the terms of the Creative Commons Attribution License (https://creativecommons.org/licenses/by/4.0), which permits unrestricted use, distribution, and reproduction in any medium, provided the original work is properly cited.
This article is published in open access under the Subscribe to Open model. This email address is being protected from spambots. You need JavaScript enabled to view it. to support open access publication.
1. Introduction
The active galactic nuclei (AGNs) family is proving to be increasingly complex and diverse. A classical distinction exists between jetted and non-jetted AGNs (Padovani et al. 2017). We can further divide the jetted class into three main categories: flat-spectrum radio quasars (FSRQs), BL Lacertae objects (BL Lacs), and jetted narrow-line Seyfert 1s (NLS1s), together with their misaligned counterparts. Misaligned AGNs are characterized by large viewing angles, while the jet axes of FSRQs, BL Lacs, and NLS1s are directed toward the Earth (for recent reviews, see, e.g., Foschini 2017 and Blandford et al. 2019).
The optical spectra of jetted AGNs display a wide range of features, from prominent emission lines – as in the case of FSRQs and γ-ray NLS1s – to weak or absent lines, as observed in BL Lacs. The same applies to misaligned AGNs. Of particular interest is the distinction between FSRQs and γ-ray NLS1s. Both can exhibit Balmer and forbidden lines, but NLS1s are classically defined by the presence of weak oxygen lines ([O III]/Hβ < 3) and strong iron emission. The main discriminant between NLS1s and FSRQs lies in the full width at half maximum (FWHM) of the Hβ line: above 2000 km s−1 for FSRQs and below 2000 km s−1 for NLS1s (Osterbrock & Pogge 1985; Goodrich 1989).
After the discovery of γ-NLS1s, many open questions arose or gained new relevance, such as what the role of γ-NLS1s in the blazar sequence is given their low black hole masses, and whether γ-NLS1s can help pinpoint the region where γ-rays are produced in AGNs. The answer to the first question came in 2016, when Berton et al. (2016) suggested that γ-ray NLS1s represent the low-mass and low-luminosity tail of the blazar distribution. The answer to the second question is more complex, and different studies have presented contrasting results. Some support a central origin for the γ-rays (in the broad-line region or dusty torus; see, e.g., Marscher et al. 2008; Ghisellini et al. 2014), while others favor a more distant origin (in the narrow-line region; see, e.g., Foschini et al. 2019; Dalla Barba et al. 2025). In both cases, γ-NLS1s serve as a unique laboratory for investigating the AGN jet phenomenon.
Our knowledge of the impact of NLS1s on the population of γ-ray sources is currently limited by the small number of known objects of this type. To address this, Foschini et al. (2022) selected a sample of 2980 optically identified γ-ray-emitting sources from the fourth Fermi Gamma-ray Large Area Telescope (Fermi-LAT) catalog (4FGL) and searched for available optical spectra in the literature. This led to a reclassification of a significant portion of the sample. However, many of the public observations were carried out in the 1970s-1980s and suffer from low spectral resolution and/or poor quality, which prevented a reliable classification. For these ambiguous (AMB) cases and for the candidate NLS1 found by Foschini et al. (2022), we obtained new optical spectra for a total of 22 objects, 6 in the Northern Hemisphere and 17 in the Southern Hemisphere. We excluded a few cases (see below) for a final sample of 18 objects (see Table 1). These spectra allowed us to search for additional cases of γ-NLS1s and to increase the number of known sources in this family.
Sources and their observation details.
At the same time, we identified some cases of intermediate Seyferts (ISs), a subclass of Seyfert galaxies characterized by a peculiar spectral shape of the permitted lines (Osterbrock & Koski 1976). Owing to the intermediate viewing angle, the observer can detect radiation from both narrow-line regions (NLRs) and broad-line regions (BLRs), resulting in a composite line profile with broad wings and a narrow core. These two contributions are usually modeled with separate Gaussian components, referred to as the broad and narrow components, whose combination reproduces the total observed emission. Because of the peculiar spectral shape of Hβ, ISs are often misclassified as NLS1s, and vice versa (see, e.g., Järvelä et al. 2020; Crepaldi et al. 2025). Disentangling the two classes requires high-resolution spectra, as confirmed by the borderline NLS1-IS cases found in our sample. Moreover, according to the unified model (Keel 1980; Antonucci 1993; Urry & Padovani 1995), the intermediate viewing angle expected for ISs makes their γ-ray detection particularly puzzling with respect to jet orientation. The inclusion of NLS1s and ISs as γ-ray-emitting AGNs will help us investigate the jetted AGN phenomenon in greater detail, including classes of sources that are often overlooked.
The structure of this paper is as follows. In Sect. 2 we describe the observations and the data analysis. In Sect. 3 we list the classification criteria. In Sect. 4 we explain how we estimated the physical parameters, including the black hole mass (MBH) and the Eddington ratio (REdd). In Sect. 5 we provide details of the individual analyzed objects. In Sect. 6 we discuss the new classifications and present our conclusions. Throughout this paper, we adopt a standard Λ Cold Dark Matter cosmology with H0 = 73.3 km s−1 Mpc−1, Ωmatter = 0.3, and Ωvacuum = 0.7 (Riess et al. 2022).
2. Observations and data analysis
From the original sample of nearly 3000 objects analyzed by Foschini et al. (2022), we selected a subsample of 22 sources for which we requested high-quality spectra. The subsample is the result of the selection of those objects classified by Foschini et al. (2022) as NLS1 or AMB in their paper, taking also into account for the observability of the objects. The objects are divided into two groups: those in the Northern Hemisphere and those in the Southern Hemisphere.
The new data were collected using the Optical System for Imaging and low-Intermediate-Resolution Integrated Spectroscopy (OSIRIS), mounted on the Gran Telescopio Canarias (GTC) in the Northern Hemisphere (Program GTC33-22B, PI: E. Järvelä), and the FOcal Reducer/low dispersion Spectrograph 2 (FORS2), mounted on Unit Telescope 1 of the Very Large Telescope (UT1/VLT) in the Southern Hemisphere (Programs 110.23UC.003, PI: C. Mazzucchelli; 111.24P0.002, PI: M. Berton). The OSIRIS sample comprises 6 sources. The FORS2 sample initially included 17 objects as part of a filler program designed for observations during nonoptimal conditions at Paranal. The UT1 observations cover 12 of the 17 objects; one spectrum corresponds to PKS 2004−447 (J2007−4432), which was excluded from this analysis as it has already been studied in detail by Berton et al. (2021), and the other four spectra show only forbidden narrow lines with FWHM dominated by instrumental broadening. As such, they cannot be used to refine the classification or to derive reliable physical parameters. The final sample, consisting of 18 objects, is listed in Table 1.
The GTC observations were carried out with the following setup: a 1″ slit and the R1000R grism, yielding a spectral resolution of R = λ/Δλ = 11221. Standard stars were observed with a 2.52″ slit. The OSIRIS spectral coverage is 3650–10 000 Å. The UT1/VLT setup was: a 1″ slit and the 300V grism, resulting in a spectral resolution of R = 4402. The FORS2 spectral coverage is 3300–11 000 Å. Further details are provided in Table 1.
The reduction of the GTC data was carried out with a standard procedure using IRAF (version 2.18; Tody 1986, 1993). For VLT observations, we used the already reduced data that can be found in the European Southern Observatory (ESO) archive3.
Due to the different slit apertures used for the sources and the standard stars in the GTC observations, a flux correction was applied to the final spectra. Next, for each spectrum, we corrected for reddening and identified the main optical emission lines to compute the redshift (z). The redshift was calculated as the flux-weighted average of the individual z values derived from the [O II]λ3727, Hβ, and [O III]λλ4959,5007 lines, when present. In one case, J2354−0958, the measured redshift differed significantly from the value reported in the literature; see Sect. 5.18 for details. The resulting redshifts are listed in Table A.1. Continuum subtraction was performed using the dedicated IRAF function. Iron multiplets emission lines were removed using the tool developed by Kovačević et al. (2010) and Shapovalova et al. (2012), available through the Serbian Virtual Observatory4. The iron fitting allows us to calculate the R4570 parameter, defined as the ratio between the flux of the blueward iron bump (relative to Hβ) and the flux of the Hβ line.
After these preprocessing steps, we fitted the Hβ–[O III] complex, where feasible. In some spectra, the region around Hβ and [O III] was too noisy (e.g., J0102+4214), or significantly affected by atmospheric absorption (e.g., J0224+0700). In such cases, we fitted only the [O III]λλ4959,5007 lines, or alternatively the Mg II λ2800 line. We did not perform a telluric correction because the resulting spectral profile cannot be completely trusted to calculate the FWHM and to propose a reliable classification of the AGN.
The Hβ line was modeled using four alternative profiles: three Gaussians, two Gaussians, one Gaussian, or a Lorentzian. The first two profiles are typically attributed to IS, when the broad and the narrow component are clearly separable, but they can also fit NLS1 well in low- or intermediate-resolution spectra (Dalla Barba et al. 2023). The single Gaussian with a FWHM comparable to the one of narrow lines is typical of type 2 AGNs. The Lorentzian profile, instead, is typical of NLS1 (Sulentic et al. 2002, 2009; Goad et al. 2012; Cracco et al. 2016; Berton et al. 2020).
For the [O III]λλ4959,5007 doublet, a single Gaussian was sufficient in most cases; however, a two-Gaussian model was adopted when required. This composite model includes a narrow core component from the NLR and an additional outflow component. The two [O III] lines were tied in terms of FWHM, central wavelength, and flux, assuming the theoretical intensity ratio of 2.993 ± 0.014 (Dimitrijević et al. 2007). Parameter uncertainties were estimated using a Monte Carlo method creating N = 1000 synthetic spectra. For each iteration, we added a Gaussian noise to the line profile, proportional to the standard deviation of the signal in the continuum between 5050 and 5150 Å.
3. Classification criteria
As already introduced in Sect. 1, the optical classification of jetted AGNs is not always straightforward, especially when dealing with low-S/N spectra. This is particularly true for ISs and NLS1s, which are often prone to misclassification. The difficulty mainly arises from the similarity in the observed Hβ line profiles when its FWHM is close to 2000 km s−1, the conventional threshold adopted to distinguish NLS1s from broader-lined sources (see, e.g., Fig. 2 in Dalla Barba et al. 2023).
Indeed, a Lorentzian profile – commonly used to model the permitted lines in NLS1s – can resemble a composite of two or more Gaussian components, typically employed for ISs (and vice versa). This degeneracy in fitting can lead to AMB classifications, particularly in low-resolution or noisy spectra. From a physical standpoint, the Lorentzian shape is generally associated with turbulent motions in the BLR, while the Gaussian components are interpreted as arising from clouds in Keplerian motion within the BLR (e.g., Kollatschny & Zetzl 2011; Goad et al. 2012). This highlights that the choice of model to fit the Hβ line is not merely a technical matter but reflects underlying physical conditions. Therefore, the distinction between ISs and NLS1s is not only observational but also tied to the kinematics and structure of the BLR, and cannot be attributed solely to orientation effects.
Furthermore, the Hβ line profile can exhibit marked asymmetries. Such asymmetries can arise from a variety of physical processes. One possibility is the presence of an outflow, often modeled as a moving bubble of ionized gas, which can produce blue- or red-asymmetric line wings (e.g., Boroson & Green 1992). Another potential explanation involves double-peaked emission lines, which can originate from a rotating Keplerian disk around the central black hole (e.g., Dumont & Collin-Souffrin 1990; Chen et al. 1989). Finally, asymmetric and systematically shifted line profiles have been proposed as possible signatures of close binary supermassive black holes, where the orbital motion of the BLRs around the two black holes induces observable Doppler shifts (e.g., Gaskell 1996). While these more complex scenarios are fascinating, they typically manifest in distinctly double-peaked broad-line profiles, which are not observed in the present sample. Therefore, such interpretations can be reasonably excluded in the context of this work. Nonetheless, the variety of possible Hβ profiles illustrates the necessity for careful spectral modeling and a multifaceted classification approach when dealing with jetted AGNs.
These considerations underscore the intrinsic challenges in providing a conclusive optical classification for AGNs, particularly when relying solely on spectral features that can be affected by noise, resolution, and modeling degeneracies. Despite these limitations, in the following we outline the empirical criteria adopted to classify the objects in the present sample. These criteria aim to balance the need for physical consistency with the constraints imposed by the available data:
-
NLS1s: Sources showing a Lorentzian Hβ profile or a multiple-Gaussian fit with smooth wings (i.e., no distinct separation between the NLR and the BLR), with a total FWHM < 2000 km s−1. These spectra typically exhibit weak [O III] lines, with [O III]/Hβ < 3, and often show the presence of optical Fe II multiplets.
-
Broad-line Seyfert 1s (BLS1s): Classical type 1 AGNs characterized by a broad Hβ line with a total FWHM > 2000 km s−1. The Hβ profile can be fit by either a single Gaussian or multiple components, but the broadness is the defining feature.
-
ISs: AGNs that show multiple-Gaussian Hβ profiles with a clear separation between the NLR and BLR components. Unlike NLS1s, no strict cut is imposed on the [O III]/Hβ flux ratio or on the presence of Fe II lines. This class includes Seyfert 1.2–1.9 types and generally exhibits intermediate obscuration between type 1 and type 2 AGNs.
-
Seyfert 2s (SY2s): Sources displaying only narrow emission lines, typically with FWHMs of ∼1000 km s−1. They are associated with type 2 AGNs and are interpreted as systems viewed edge on such that the BLR is obscured or totally absent (see the case of true SY2, e.g. Pogge 2003; Bianchi et al. 2012; Miniutti et al. 2013 and references therein).
-
AMBs: A heterogeneous class reported by Foschini et al. (2022), including objects for which no reliable classification could be assigned. These cases lack crucial information such as published optical spectra, measurable Hβ FWHM, or reliable positional cross-identification. Furthermore, the viewing angle remains unconstrained.
4. Physical parameters
4.1. Black hole mass (MBH)
To estimate the black hole mass, we adopted Eqs. (38) and (40) from Dalla Bontà et al. (2020), which relates MBH to the luminosity and line width of Hβ – specifically, the second-order moment (σHβ) or the FWHM in the case of Lorentzian profiles. As noted by Dalla Bontà et al. (2020), the second-order moment is generally preferred over the FWHM as it yields tighter correlations with black hole mass. Furthermore, these relations avoid the intermediate step involving the continuum luminosity at 5100 Å, which is a significant advantage when analyzing jetted sources. In such cases, jet emission can contaminate the continuum, leading to an overestimation of the black hole mass.
The adopted equations are
![Mathematical equation: $$ \begin{aligned} \mathrm{{log}}\left( \frac{M_{\rm {BH}}}{M_{\odot }}\right) = {\log }(f)&+7.530+0.703\times \left[{\log }\left(\frac{L_{\mathrm{H}\beta _{\rm {broad}}}}{\mathrm{{erg\,s}^{-1}}}\right)-42\right]+\nonumber \\&+2.183\times \left[{\log }\left(\frac{\sigma _{\rm H\beta }}{\mathrm{{km\,s}^{-1}}}\right)-3.5\right] \end{aligned} $$](/articles/aa/full_html/2026/01/aa57187-25/aa57187-25-eq1.gif) (1)
(1)
![Mathematical equation: $$ \begin{aligned} {\log }\left( \frac{M_{\rm {BH}}}{M_{\odot }}\right) = {\log }(f)&+7.015+0.784\times \left[{\log }\left(\frac{L_{\mathrm{H}\beta _{\rm {broad}}}}{\mathrm{{erg\,s}^{-1}}}\right)-42\right]+\nonumber \\&+1.387\times \left[{\log }\left(\frac{\mathrm{{FWHM(H\beta )}}}{\mathrm{{km\ s}^{-1}}}\right)-3.5\right], \end{aligned} $$](/articles/aa/full_html/2026/01/aa57187-25/aa57187-25-eq2.gif) (2)
(2)
where σHβ is the second-order moment. The relations show a scatter of 0.309 dex and 0.371 dex, respectively. The geometrical factor adopted is the total value reported by Collin et al. (2006), in order to avoid assumptions about the population nature of our sample. It corresponds to f = (3.85 ± 1.15). LHβbroad denotes the luminosity of the broad component of the Hβ line.
For sources in which the Hβ line is not detected – due to either absorption or spectral noise – we estimated the black hole mass using the Mg IIλ2800 or [O III]λ5007 lines. Relations based on Mg IIλ2800 suffer from the same issue as Hβ when the continuum contribution at 3000 Å is included. For this reason, we adopted the relation from Trakhtenbrot & Netzer (2012):
![Mathematical equation: $$ \begin{aligned} {\log }\left( \frac{M_{\rm {BH}}}{M_{\odot }}\right) = 6.83+0.5&\times {\log }\left(\frac{L_{\rm {Mg\ II}}}{10^{42}\ \mathrm{{erg\,s}^{-1}}}\right)\nonumber \\&+2\times {\log }\left[\frac{\mathrm{{FWHM(Mg\ II)}}}{10^3\ \mathrm{{km\,s}^{-1}}}\right], \end{aligned} $$](/articles/aa/full_html/2026/01/aa57187-25/aa57187-25-eq3.gif) (3)
(3)
which relies solely on the luminosity and FWHM of the Mg IIλ2800 line, thus avoiding the use of the continuum luminosity. The scattering for this relation is of 0.13 dex.
The relations based on [O III], however, are known to provide less reliable results, and we therefore treated the corresponding mass estimates as upper limits. The tendency of [O III] to overestimate black hole masses in active galaxies has already been discussed by Ho & Kim (2014). For these cases, we used the revised M − σ★ relation from Ho & Kim (2014):
 (4)
(4)
where σ★ = FWHM([O III]core)/2.35, and FWHM([O III]core) is the width of the core component only. The limitation of this method is evident in Fig. 4 of Greene & Ho (2005), where the data show a significant scatter around the relation. The results for all sources are reported in Table A.1.
4.2. Eddington ratio (REdd)
The Eddington ratio is calculated as
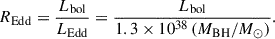 (5)
(5)
The black hole mass used is the one derived in the previous paragraph. The bolometric luminosity (Lbol), on the other hand, can be estimated using the classical relation Lbol = 9 × λLλ(5100 Å) from Kaspi et al. (2000), or with a revised version from Netzer (2019):
![Mathematical equation: $$ \begin{aligned} L_{\rm {bol}} = k_{\rm {bol}} \times \lambda L_{\lambda }(5100\,\AA ) \quad ; \quad k_{\rm {bol}} = 40 \cdot \left[\frac{\lambda L_{\lambda }(5100\,\AA )}{10^{42}\,\mathrm{{erg\ s}^{-1}}}\right]^{-0.2} ,\end{aligned} $$](/articles/aa/full_html/2026/01/aa57187-25/aa57187-25-eq6.gif) (6)
(6)
where λLλ(5100 Å) is the continuum luminosity at 5100 Å. The bolometric correction factor (kbol) should also be adjusted for source inclination. For type 1 AGNs (typical inclination of ∼56°), the correction factor is ∼1.4, while for face-on accretion disks it is ∼2.5 (Netzer 2019). Due to the lack of reliable inclination information, we adopted an average value of 2, as done by Crepaldi et al. (2025).
To determine Lbol, we first needed the continuum luminosity at 5100 Å. This parameter can be directly measured from the spectrum in non-jetted sources; however, in jetted AGNs, the jet contributes significantly to the continuum, making it difficult to disentangle from the thermal emission of the accretion disk. In such cases, line properties must instead be used. To this end, we applied the relation from Dalla Bontà et al. (2020), which connects λLλ(5100 Å) to LHβ, broad:
![Mathematical equation: $$ \begin{aligned} \log \left[\lambda L_{\lambda }(5100\, \AA )\right] = (43.396&\pm 0.018)+(1.003\pm 0.022)\nonumber \\&\times \left[\log \left({\frac{L_{\rm {H}\beta _{\rm {broad}}}}{\mathrm{{erg\ s}^{-1}}}}\right)-41.746\right]. \end{aligned} $$](/articles/aa/full_html/2026/01/aa57187-25/aa57187-25-eq7.gif) (7)
(7)
This approach relies entirely on the properties of the Hβ line.
For objects in which Hβ is undetected or affected by absorption, we used either the Mg II λ2800 or [O III]λ5007 lines. For the Mg II line, we used an analogous procedure to that applied for Hβ, calculating the expected continuum luminosity at 3000 Å, λLλ(3000 Å), from the line properties. Combining Eqs. 8 and 7 from Trakhtenbrot & Netzer (2012), we obtain
![Mathematical equation: $$ \begin{aligned} \log \left[\frac{\lambda L_{\lambda }(3000\, \AA )}{10^{44}\,\mathrm{{erg\ s}^{-1}}}\right] = 0.08+0.81\times \log \left({\frac{L_{\rm {Mg\ II}}}{10^{42}\ \mathrm{{erg\ s}^{-1}}}}\right) ,\end{aligned} $$](/articles/aa/full_html/2026/01/aa57187-25/aa57187-25-eq8.gif) (8)
(8)
the result of which can be inserted in the corresponding relation for the Eddington ratio of Netzer (2019):
![Mathematical equation: $$ \begin{aligned} L_{\rm {bol}} = k_{\rm {bol}} \times \lambda L_{\lambda }(3000\, \AA ) ; \quad k_{\rm {bol}} = 19 \cdot \left[\frac{\lambda L_{\lambda }(3000\, \AA )}{10^{42}\,\mathrm{{erg\ s}^{-1}}}\right]^{-0.2} .\end{aligned} $$](/articles/aa/full_html/2026/01/aa57187-25/aa57187-25-eq9.gif) (9)
(9)
The adopted equation for the [O III] case, from Zhang & Feng (2017), is
![Mathematical equation: $$ \begin{aligned} \log \left[\frac{\lambda L_{\lambda }(5100\, \AA )}{\mathrm{{erg\,s}^{-1}}}\right] = (17.28 \pm 0.98)\cdot \log \left(\frac{L_{\rm {[O\ III]}_{\rm {core}}}}{\mathrm{{erg\ s}^{-1}}}\right) + (0.65 \pm 0.02) ,\end{aligned} $$](/articles/aa/full_html/2026/01/aa57187-25/aa57187-25-eq10.gif) (10)
(10)
where L[O III]core is the luminosity of the core component of the [O III]λ5007 line. As for the black hole mass, Eddington ratios derived from the [O III]λ5007 line should be considered as upper limits. The results are summarized in Table A.1.
5. Notes on individual objects
In the following, we provide the emission lines fitting details for each source, along with the explanation for the new classification. The fitting parameters are reported in Table A.1, while the spectra are plotted in Fig. B.1.
5.1. J0102+4214
The GTC spectrum is significantly affected by noise. The Hβ–[O III] complex shows a prominent bump and is partially obscured by telluric absorption, which may result from Fe II emission or host-galaxy contamination. This prevents us from proposing a definitive classification of the AGN. To extract physical parameters, we fitted the Mg IIλ2800 line, as reported in Table A.1. A tentative fit of the Hβ line with a single Lorentzian profile yields FWHM(Hβ) = (2931 ± 980) km s−1. This value is consistent with the estimate reported by Shaw et al. (2012), FWHM(Hβ) ∼ 1900 km s−1, but does not support a classification as NLS1. The [O III]λλ4959, 5007 lines are severely affected by telluric absorption and buried in the noise. Consequently, we are unable to provide a revised classification for this object and therefore adopt the NLS1 classification reported by Foschini et al. (2022).
5.2. J0224+0700
The GTC spectrum reveals a few oxygen lines ([O II]λ3727 and [O III]λλ4959,5007), as well as Mg IIλ2800 emission. In this case, telluric absorptions are prominent in both the Hβ and Hγ regions, preventing us from characterizing the line profiles or measuring their FWHM. On the other hand, the Mg II line is relatively unaffected by atmospheric absorption, allowing us to derive the black hole mass and the Eddington ratio. We report the same classification proposed by Foschini et al. (2022): NLS1.
5.3. J0422−0644
The UT1 spectrum shows multiple emission lines, both permitted (Hα, Hβ, and Hγ) and forbidden ([O III]λλλ4363, 4959, 5007). The Hβ–[O III] region is characterized by prominent Fe II emission, with R4570 ∼ 1.19. After subtracting the Fe II contribution, we fitted the Hβ line using three Gaussian components (two broad and one narrow), and modeled the [O III] lines with single Gaussian profiles. The resulting total FWHM(Hβ) = (1940 ± 119) km s−1, placing the object in the classical NLS1 family. Finally, the [O III]/Hβ flux ratio is approximately 0.22, confirming the relative faintness of the oxygen lines compared to the hydrogen lines. From these parameters we can propose a classification of NLS1.
5.4. J0442−0017
Luna-Cervantes et al. (2024) studied in detail the spectral energy distribution of this AGN and proposed a hybrid nature, between NLS1 and FSRQ. The UT1 spectrum is noisy and affected by atmospheric absorption features; however, the Hβ–[O III] region is only partially impacted. The Fe II emission contributes significantly, with R4570 ∼ 1.05, although the He IIλ4686 line is also present in the same spectral region. The best fit for the Hβ line was obtained using a Lorentzian profile, while the [O III]λλ4959,5007 lines were modeled with single Gaussians. The resulting total FWHM(Hβ) = (3518 ± 1218) km s−1, outside the range typically associated with NLS1s, although the large uncertainty – mainly due to the noise level in the Hβ region – limits the robustness of this measurement. The [O III]/Hβ flux ratio is ∼0.90, consistent with type 1 AGN properties. Given the large uncertainty on the FWHM(Hβ), our results are consistent with those of Shaw et al. (2012) and Foschini et al. (2022) while also being compatible with a BLS1 classification. Considering the central value of the Hβ width, we suggest a BLS1 classification, although higher-resolution spectra are required to confirm this result.
5.5. J0515−4556
The UT1 spectrum reveals all the main optical features, with a not negligible Fe II contribution (R4570 ∼ 0.44). The [O III]λλ4959,5007 lines display two peculiar characteristics: a blueshift of the entire feature by approximately 132 km s−1, and a flux ratio of about 2, which deviates from the theoretical value of ∼3 (as can be seen from Fig. B.1). This can be the result of a spurious spike under [O III]λ4959, or due to the very broad component found in Hβ. The Hβ line was modeled with three Gaussian components, and the resulting profile shows a redshifted very broad component (Δv ∼ 3700 km s−1). Furthermore, the [O III]/Hβ flux ratio is ∼0.77. The asymmetric profile of Hβ can be the result of an NLS1 or and IS with a red wing. Given the γ-ray detection for this AGN, the orientation favor the type 1 classification for this object, but does not exclude the IS one. The total FWHM(Hβ) = (1534 ± 85) km s−1. Due to these considerations, we propose a classification in between NLS1 and IS, to disentangle between the two, intermediate- or high-resolution spectra are needed.
5.6. J0521−1734
The UT1 spectrum shows a relatively noisy red part, but the Hβ–[O III] region is not affected by these fluctuations. The best fit for Hβ was obtained with a single Gaussian component, with its FWHM tied to that of [O III], yielding FWHM([O III]) = (845 ± 30) km s−1. The strength of the [O II]λ3727 line suggests a possible low-ionization nuclear emission-line region (LINER) nature for this AGN. However, a classification as a SY2 appears more likely, given the profiles of [O III]λ5007 and Hβ. In this scenario, J0521−1734 could be interpreted either as a misaligned AGN or as a true SY2 lacking a BLR (e.g., Marin et al. 2025). Distinguishing between the LINER and SY2 scenarios requires high- or intermediate-resolution spectroscopy with broader spectral coverage, ideally including Hα to enable the construction of diagnostic diagrams such as those developed by Baldwin et al. (1981) and Veilleux & Osterbrock (1987). Moreover, to confirm a possible absence of the BLR, polarized-light observations would be necessary.
5.7. J0932+5306
In the GTC spectrum, all the main optical features are clearly detected. The iron emission is negligible, which leave space to the detection of the He IIλ4686 line. The best fit for the Hβ line was obtained using a combination of Gaussian components, yielding a total FWHM(Hβ) = (1439 ± 88) km s−1. Each of the [O III] lines was modeled with a single Gaussian. The [O III]/Hβ flux ratio is ∼1.50, a value consistent with those typically observed in NLS1 galaxies. The relatively narrow Hβ line width and the weakness of the [O III] lines both support a classification as NLS1, despite the absence of significant Fe II emission. Similar cases of NLS1s with faint or undetectable Fe II features have been reported in the literature (e.g., Pogge 2011). We therefore confirm the classification of NLS1 proposed by Foschini et al. (2022).
5.8. J1048−1912
The UT1 spectrum shows fluctuations in the Hβ–[O III] region. We fitted oxygen lines with a single Gaussian each and a combination of two Gaussians for Hβ. The resulting Hβ profile is typical of an IS object, where the narrow and the broad components are clearly separable. The narrow component present a FWHM(Hβ) totally dominated by the instrumental broadening, as the one of [O III]λ5007. The Hβ broad component present a FWHM(Hβ) = (6040 ± 189) km s−1 with a significant shift to the red with Δv ∼ 1528 km s−1. The global FWHM(Hβ) is consistent with the value reported by Murdoch et al. (1984). The iron contribution is negligible (R4570 ∼ 0), and the [O III]/Hβ ratio is approximately 0.81. This allows us to reclassify the object as an IS, given the composite profile of Hβ. Following the classification scheme proposed by Whittle (1992), the IS type can be obtained calculating the ratio between the fluxes of RSy − type = F([O III])/F(Hβ). In this case we obtain a Seyfert 1.5 type.
5.9. J1102+5251
The GTC spectrum shows a negligible iron contribution (R4570 ∼ 0) and a peculiar Hβ profile, composed of a narrow core and a prominent red wing. The FWHM of the [O III] lines and of the narrow component of Hβ are entirely dominated by instrumental broadening, whereas the broad component of Hβ has FWHM = (3051 ± 296) km s−1 and is redshifted by Δv ∼ 590 km s−1. This line shape can be interpreted as consistent with an IS. The [O III]/Hβ flux ratio is ∼1.32, which is compatible with values observed in both classes. Based on these considerations – particularly the limitations imposed by instrumental broadening – we propose this AGN be classified as an IS. Further observations with higher spectral resolution are required to confirm this scenario.
5.10. J1154+4037
The GTC spectrum is affected by several spurious peaks, which were subsequently removed. The final spectrum shows a prominent Mg IIλ2800 line with FWHM = (10098 ± 297) km s−1, while the Hβ–[O III] region is completely buried in the noise, preventing a definitive classification. Foschini et al. (2022) reported an NLS1 classification, but given the broadness of the Mg IIλ2800 line, this does not appear reliable. As a consequence of the broad Mg IIλ2800 line, the calculated black hole mass is the highest in the sample, with log(MBH/M⊙) = (9.32 ± 0.06). This result highlights the need for further investigation into the nature of the source, given that NLS1s are usually hosted in low-mass galaxies. We therefore propose classifying it as AMB.
5.11. J1202−0528
The UT1 spectrum displays all the main optical features, including both permitted and forbidden emission lines. The iron contribution is estimated to be R4570 ∼ 1.22. The Hβ line was fitted with a combination of two Gaussian components, resulting in a total FWHM(Hβ) = (1445 ± 57) km s−1, while the [O III]λλ4959,5007 lines were modeled with two Gaussians each (core and outflow components). The [O III]/Hβ ratio is ∼0.83. These properties support the classification of this object as an NLS1.
5.12. J1246−2548
The Hβ line is fitted with two Gaussian components, resulting in a total FWHM(Hβ) = (1430 ± 266) km s−1, which lies within the typical range for NLS1s. The broad component appears redshifted by Δv ∼ 420 km s−1. The [OIII]λλ4959,5007 lines are prominent, but their FWHM is completely dominated by the instrumental broadening. The flux ratio [O III]/Hβ ∼ 0.41 favor the classification of NLS1. The iron emission is negligible, with R4570 ∼ 0, but the prominent telluric absorption in the blue part of the iron emission prevented us from properly fitting these lines. Overall, we propose a classification of NLS1.
5.13. J1310+5514
In the GTC spectrum, the Hβ–[O III] region appears very noisy due to its proximity to the grism efficiency drop5, and is therefore considered as an artifact. For this reason, we excluded it from the final spectrum. The physical parameters were estimated from the Mg IIλ2800 line, fitted with a Lorentzian profile, which yields FWHM = (2271 ± 38) km s−1. New observations are required to establish a robust classification of this source. We therefore maintain the NLS1 classification proposed by Foschini et al. (2022).
5.14. J1331−1325
The UT1 spectrum displays all the main optical emission lines, from [O II]λ3727 to [S II]λλ6716,6731. The iron contribution is negligible (R4570 ∼ 0). Hβ presents a peculiar profile with a red bump (Δv ∼ 350 km s−1), best fitted with three Gaussian profiles. The resulting total FWHM(Hβ) = (575 ± 94) km s−1. The [O III]λλ4959,5007 lines are fitted with a single Gaussian each, and the [O III]/Hβ ratio is ∼2.21. Considering the shape of the Hβ profile, we suggest an IS classification for this AGN.
5.15. J1818+0903
The UT1 spectrum displays all the main optical features, from [O II]λ3727 to [O III]λ5007. The iron emission yields R4570 ∼ 0.97. The Hβ line was fitted using a Lorentzian component, resulting in a FWHM(Hβ) = (1418 ± 335) km s−1. The [O III] lines were fitted with a single Gaussian, but their FWHM is dominated by the instrumental broadening. The [O III]/Hβ ratio is ∼0.98. Based on these results, we suggest this AGN be classified as an NLS1.
5.16. J1902−6748
The UT1 spectrum covers all the main optical features, including Hα. The iron contribution is present with R4570 ∼ 0.79, and blended also with the He IIλ4686 line. The best fit for the Hβ line was obtained using a combination of three Gaussian components: the FWHM of the narrow component was tied to that of [O III], while the broad component is composed of two bumps, the broadest of which is redshifted by Δv ∼ 2400 km s−1. A similarly asymmetric profile is also visible in the Hδ line. The total FWHM(Hβ) = (1015 ± 117) km s−1. The [O III]/Hβ flux ratio is ∼2.24. This case closely resembles the one discussed in Sect. 5.5. For this reason, we propose a classification that is intermediate between NLS1 and IS. Further investigations, including higher-resolution spectroscopy, are needed to distinguish between the two scenarios.
5.17. J2325−3559
The UT1 spectrum displays the typical features of an NLS1: faint [O III]λλ4959,5007 lines with [O III]/Hβ ∼ 0.58, strong Fe II emission with R4570 ∼ 1.58, and a global FWHM(Hβ) = (971 ± 75) km s−1. The Hβ line was fitted using a single Lorentzian profile, while the [O III] lines show a core component and prominent blue wings with Δv ∼ 770 km s−1. Based on these properties, we classify the object as an NLS1.
5.18. J2354−0958
From the analysis of the UT1 optical spectrum, we conclude that the previous identification of [O II]λ3727 (Drinkwater et al. 2018) was incorrect. In the revised interpretation, we identify three lines: Mg IIλ2800, [O II]λ3727, and Hγ. Based on these features, we calculated a redshift of z = (0.9920 ± 0.0023), which is consistent with the value reported by Massaro et al. (2015). The spectrum is relatively noisy, and Hγ lies near the edge of the spectral range, limiting its usefulness for classification purposes. The Mg II line displays a broad profile, pointing toward the BLS1 nature. Due to the absence of significant Balmer lines, we do not propose a new classification for J2354−0958 and report the one proposed by Foschini et al. (2022): AMB.
6. Discussion
In this work we analyzed the optical spectra of 18 sources extracted from Foschini et al. (2022), which in turn are derived from the 4FGL catalog compiled from observations by the Fermi satellite. The 4FGL catalog is predominantly populated by BL Lac objects, FSRQs, and unclassified sources. However, it also includes other types of AGNs, such as misaligned AGNs, NLS1s, Seyfert galaxies, and changing-look AGNs (CL-AGNs) (Foschini et al. 2022).
6.1. Classes of γ-ray-emitting AGNs
Our spectroscopic analysis confirms the presence of a variety of AGN types. Specifically, we identified two new NLS1s (J0422−0644 and J2325−3559), three ISs (J1048−1912, J1102+5252, and J1331−1325), two AMB cases showing characteristics between NLS1s and ISs (J0515−4556 and J1902−6748), one BLS1 (J0442−0017), and one SY2 (J0521−1734). In addition, we confirmed the classification of four previously known NLS1s. For the remaining five sources, a reliable classification was not possible due to poor data quality or limited spectral coverage – as in the case of J2354−0958, where the available spectrum was insufficient for a robust analysis. Among these, J1154+4037 was reported as AMB because the measured width of the Mg IIλ2800 line is no longer compatible with the NLS1 class; however, a new solid classification is still not possible.
When combined with the results of Foschini et al. (2022), our findings confirm that different classes of AGNs are capable of producing powerful jets detectable in γ-rays. The separation into classes of jetted AGNs, based on the Foschini et al. (2022) sample together with three additional objects from Paliya et al. (2024) and Li et al. (2023), some of which are reclassified according to the analysis presented in this paper, is illustrated in Fig. 1. From this plot, it is clear that the majority (about 40%) are BL Lacs, where the jet dominates the observed spectrum. Another large fraction (about 23%) consists of FSRQs, γ-ray sources characterized by strong optical lines and Balmer lines with FWHM > 2000 km s−1. A further ∼29% of the sample remains unclassified.
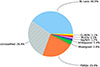 |
Fig. 1. Distribution of different source classes in the 4FGL catalog. Percentages indicate the updated number of objects in each class, based on Foschini et al. (2022) and revised according to the analysis presented in this work and other recent studies. Specifically, 2980 sources are from Foschini et al. (2022), 2 (J0105+1912 and J0933−0013) are from Paliya et al. (2024), and 1 (J0959+4600) is from Li et al. (2023). |
Beyond these three dominant groups, several minority classes are also represented. The most numerous are misaligned AGNs, which include radio galaxies, soft-spectrum radio quasars, and compact steep-spectrum quasars. Their classification, based on radio properties and inherited from 4FGL and Foschini et al. (2022), remains unchanged in this work.
Other small fractions include AMB objects (1.4%), Seyferts (1.2%), NLS1s (1.1%), and CL-AGNs (1.1%). The presence of γ-NLS1s remains of particular interest, as it challenges the standard blazar sequence scenario. Their number is steadily increasing, as confirmed by this study. Seyfert-type sources, on the other hand, comprise Seyfert 1s (SY1s), SY2s, ISs, and LINERs. While Sy1 objects are compatible with the observed γ-ray emission, SY2 (e.g., J0521−1734) and IS (e.g., J1048−1912, J1102+5251, and J1331−1325) imply an orientation inconsistent with the jet properties. This misalignment could be due to different mechanisms, such as a recent merger (Olguín-Iglesias et al. 2020), jet instabilities causing a twist (Lalakos et al. 2024), or obscuration by interstellar dust in the host galaxy. In the dust case, the AGN may be misaligned with the galaxy disk (e.g., Schmitt et al. 2002; Hopkins et al. 2012), producing a partial covering of the BLR, this misalignment is usually a consequence of a recent merger. Alternatively, dust could have been redistributed by jet-ISM interaction, introducing line-of-sight obscuration. A variable line-of-sight obscuration could also explain the CL-AGN phenomena (see Ricci & Trakhtenbrot 2023 for a recent review). Finally, in J0521−1734, a true SY2 scenario cannot be excluded. In this case, the BLR is intrinsically absent, so that the AGN is observed face-on but does not display broad permitted lines.
6.2. Physical parameters
The physical parameters derived for our sample span a wide range. The black hole masses, derived by relations that take the jet contribution to the continuum optical emission into account, lie between log(MBH/M⊙) = (6.25 ± 0.40) and (9.32 ± 0.06), with upper limits reaching up to log(MBH/M⊙) = 10.23. The Eddington ratios, instead, range from REdd = (2.07 ± 0.16) to (0.05 ± 0.03).
As expected, both the newly identified and the confirmed NLS1s exhibit black hole masses on the lower end of the AGN spectrum – typically within the range 106 − 8 M⊙, compared to 108 − 9 M⊙ for other jetted AGNs. In our sample, the NLS1s show a mean value of log(MBH/M⊙) = (7.36 ± 0.68). If we include the AMB objects with properties between NLS1s and ISs, the mean becomes log(MBH/M⊙) = (7.33 ± 0.62), which still falls within the typical NLS1 mass range.
The ISs also exhibit black hole masses within this range. However, it is important to note that in the ISs case the classical virial mass estimates are affected by partial obscuration of the BLR. Since the black hole mass is computed from the broad component of the Hβ emission line flux (see the LHβbroad term in Eq. 4), any attenuation of this component can lead to an underestimation. Therefore, for these sources, the derived black hole mass should be considered a lower limit to the actual value.
The Eddington ratio was calculated by accounting for the possible contribution of the relativistic jet to the optical continuum, particularly when using Hβ- and Mg IIλ2800-based estimates. The highest REdd in our sample are observed in J0224+0700 and J2325−3559, as expected for NLS1s. NLS1s are typically associated with slim accretion disks, which are thought to be sustained by high, or even super-Eddington, accretion rates (Shakura & Sunyaev 1973; Abramowicz et al. 1980, 1988; Balbus & Hawley 1991; Wang et al. 1999; Mineshige et al. 2000; Sądowski et al. 2014). These regimes are often interpreted as indicative of rapidly growing black holes in AGNs at an early evolutionary stage.
6.3. The role of the R4570 index
A key diagnostic parameter in our analysis is the R4570 index, which quantifies the strength of the optical Fe II emission relative to the Hβ line. This parameter plays a fundamental role in the classification of AGNs along the so-called quasar main sequence (MS). The MS represents the distribution of type 1 quasars in the FWHM(Hβbroad)–R4570 plane, and is widely used to investigate the diversity of quasar spectral properties. Within this plane (see the example in Fig. 2), a grid of spectral types has been defined: types A1 through A4 correspond to increasing Fe II emission, whereas B1, B1+, and B1++ indicate increasing FWHM of the broad Hβ component. A horizontal threshold at FWHM(Hβbroad) ∼ 4000 km s−1 separates Population A (pop. A) from Population B (pop. B). These populations are believed to group sources sharing broadly similar physical conditions and BLR geometry.
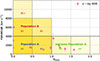 |
Fig. 2. FWHM(Hβbroad)–R4570 plane that defines the quasar MS. Pop. A and B are shown, together with their finer subdivisions. Shaded regions indicate the areas populated by quasars, with the color intensity representing the source density in each region. The pink points represent the objects in the current sample for which the FWHM(Hβbroad) and R4570 were measured. |
Boroson & Green (1992) identified several physical drivers that can influence the position of a quasar within the MS, including: REdd, MBH, the BLR cloud covering factor, the anisotropy of the continuum emission, the viewing angle of the source with respect to the observer, the velocity distribution of BLR clouds, and the ionization parameter. These factors contribute to shaping both the line widths and the strength of Fe II emission observed in quasar spectra, and hence their location along the MS. The R4570 index therefore serves not only as a classification tool, but also as a tracer of the physical conditions in the nuclear region of AGNs (Marziani et al. 2018).
In this framework, NLS1s occupy the lower-right region of the MS diagram, due to their relatively narrow Hβ lines and typically strong Fe II emission. In other words, NLS1s belong to pop. A, or even to the so-called extreme pop. A (defined as sources with R4570 > 1). As described by Marziani et al. (2018), the differences between pop. A and B extend beyond line widths: pop. A sources typically show symmetric, often Lorentzian-shaped Balmer profiles, while pop. B sources exhibit broader, multicomponent profiles with possible redward asymmetries. Additionally, lines such as C IVλ1549, Mg IIλ2800, and the [O III]λλ4959,5007 doublet often show significant blueshifts in pop. A sources. Other trends include a higher probability of radio-loudness and a flatter soft X-ray slope among pop. B objects (Grupe 2004; Zamfir et al. 2010).
Within our sample, all sources classified as NLS1 exhibit symmetric Hβ profiles, fitted with either a single Lorentzian or multiple Gaussians. Asymmetric Balmer lines, instead, are found in sources classified as IS or in the AMB cases between NLS1 and IS. All NLS1s in our sample belong to pop. A, as expected by construction. The AMB cases also fall within pop. A. One exception is the source J1048−1912, which displays a very broad Hβbroad line (FWHM ∼ 6101 km s−1) and lacks detectable Fe II emission; it is therefore assigned to pop. B. These considerations strength our classification, within the MS framework.
7. Conclusions
We have increased the number of optically and spectroscopically confirmed NLS1s with γ-ray emission to 26. This number increases further to 36 – the 34 listed in Table C.1 and the 2 additional borderline NLS1–IS objects reported in this work – if we include AMB cases. The complete list of γ-ray-emitting NLS1s is provided in Table C.1.
To resolve the ambiguous classification and to provide a more robust characterization of those sources for which we currently report only the classifications from Foschini et al. (2022), higher-spectral-resolution datasets (e.g., as obtained by VLT/X-shooter) are necessary. The X-shooter spectra could allow us to perform a detailed optical analysis of the selected sources, enabling accurate measurements of line profiles and physical parameters. They could also facilitate the identification of peculiar cases, similar to the one recently reported by Dalla Barba et al. (2025), and ultimately improve our understanding of the diversity among γ-ray-emitting AGNs.
Acknowledgments
B.D.B. thank Dr. P. Ratnaparkhi and Dr. A. Costa for the for the fruitful discussion during the “Extragalactic jets at all scales: a Cretan view” conference (Heraklion, August 25-29). C.M. acknowledges support from Fondecyt Iniciacion grant 11240336 and the ANID BASAL project FB210003. Based on observations collected at the European Southern Observatory under ESO programs 110.23UC.003 and 111.24P0.002. Based on data obtained from the ESO Science Archive Facility with DOI: https://doi.org/10.18727/archive/77. Based on observations made with the Gran Telescopio Canarias (GTC), installed at the Spanish Observatorio del Roque de los Muchachos of the Instituto de Astrofísica de Canarias, on the island of La Palma.
References
- Abramowicz, M. A., Calvani, M., & Nobili, L. 1980, ApJ, 242, 772 [NASA ADS] [CrossRef] [Google Scholar]
- Abramowicz, M. A., Czerny, B., Lasota, J. P., & Szuszkiewicz, E. 1988, ApJ, 332, 646 [Google Scholar]
- Antonucci, R. 1993, ARA&A, 31, 473 [Google Scholar]
- Balbus, S. A., & Hawley, J. F. 1991, ApJ, 376, 214 [Google Scholar]
- Baldwin, J. A., Phillips, M. M., & Terlevich, R. 1981, PASP, 93, 5 [Google Scholar]
- Berton, M., Caccianiga, A., Foschini, L., et al. 2016, A&A, 591, A98 [NASA ADS] [CrossRef] [EDP Sciences] [Google Scholar]
- Berton, M., Björklund, I., Lähteenmäki, A., et al. 2020, Contrib. Astron. Obs. Skalnate Pleso, 50, 270 [NASA ADS] [Google Scholar]
- Berton, M., Peluso, G., Marziani, P., et al. 2021, A&A, 654, A125 [NASA ADS] [CrossRef] [EDP Sciences] [Google Scholar]
- Bianchi, S., Panessa, F., Barcons, X., et al. 2012, MNRAS, 426, 3225 [NASA ADS] [CrossRef] [Google Scholar]
- Blandford, R., Meier, D., & Readhead, A. 2019, ARA&A, 57, 467 [NASA ADS] [CrossRef] [Google Scholar]
- Boroson, T. A., & Green, R. F. 1992, ApJS, 80, 109 [Google Scholar]
- Chen, K., Halpern, J. P., & Filippenko, A. V. 1989, ApJ, 339, 742 [NASA ADS] [CrossRef] [Google Scholar]
- Collin, S., Kawaguchi, T., Peterson, B. M., & Vestergaard, M. 2006, A&A, 456, 75 [NASA ADS] [CrossRef] [EDP Sciences] [Google Scholar]
- Cracco, V., Ciroi, S., Berton, M., et al. 2016, MNRAS, 462, 1256 [NASA ADS] [CrossRef] [Google Scholar]
- Crepaldi, L., Berton, M., Dalla Barba, B., et al. 2025, A&A, 696, A74 [NASA ADS] [CrossRef] [EDP Sciences] [Google Scholar]
- Dalla Barba, B., Berton, M., Foschini, L., et al. 2023, Physics, 5, 1061 [Google Scholar]
- Dalla Barba, B., Berton, M., Foschini, L., et al. 2025, A&A, 698, A320 [NASA ADS] [CrossRef] [EDP Sciences] [Google Scholar]
- Dalla Bontà, E., Peterson, B. M., Bentz, M. C., et al. 2020, ApJ, 903, 112 [CrossRef] [Google Scholar]
- Dimitrijević, M. S., Kovačević, J., Popović, L., Dačić, M., & Ilić, D. 2007, in Fifty Years of Romanian Astrophysics, eds. C. Dumitrache, N. A. Popescu, M. D. Suran, & V. Mioc (AIP), AIP Conf. Ser., 895, 313 [Google Scholar]
- Drinkwater, M. J., Byrne, Z. J., Blake, C., et al. 2018, MNRAS, 474, 4151 [Google Scholar]
- Dumont, A. M., & Collin-Souffrin, S. 1990, A&A, 229, 313 [NASA ADS] [Google Scholar]
- Foschini, L. 2017, Front. Astronomy and Space Sciences, 4, 6 [Google Scholar]
- Foschini, L., Ciroi, S., Berton, M., et al. 2019, Universe, 5, 199 [NASA ADS] [CrossRef] [Google Scholar]
- Foschini, L., Lister, M. L., Andernach, H., et al. 2022, Universe, 8, 587 [NASA ADS] [CrossRef] [Google Scholar]
- Gaskell, C. M. 1996, ApJ, 464, L107 [CrossRef] [Google Scholar]
- Ghisellini, G., Tavecchio, F., Maraschi, L., Celotti, A., & Sbarrato, T. 2014, Nature, 515, 376 [NASA ADS] [CrossRef] [Google Scholar]
- Goad, M. R., Korista, K. T., & Ruff, A. J. 2012, MNRAS, 426, 3086 [Google Scholar]
- Goodrich, R. W. 1989, ApJ, 342, 224 [Google Scholar]
- Greene, J. E., & Ho, L. C. 2005, ApJ, 627, 721 [NASA ADS] [CrossRef] [Google Scholar]
- Grupe, D. 2004, AJ, 127, 1799 [NASA ADS] [CrossRef] [Google Scholar]
- Ho, L. C., & Kim, M. 2014, ApJ, 789, 17 [NASA ADS] [CrossRef] [Google Scholar]
- Hopkins, P. F., Hayward, C. C., Narayanan, D., & Hernquist, L. 2012, MNRAS, 420, 320 [NASA ADS] [CrossRef] [Google Scholar]
- Järvelä, E., Berton, M., Ciroi, S., et al. 2020, A&A, 636, L12 [NASA ADS] [CrossRef] [EDP Sciences] [Google Scholar]
- Kaspi, S., Smith, P. S., Netzer, H., et al. 2000, ApJ, 533, 631 [Google Scholar]
- Keel, W. C. 1980, AJ, 85, 198 [Google Scholar]
- Kollatschny, W., & Zetzl, M. 2011, Nature, 470, 366 [NASA ADS] [CrossRef] [Google Scholar]
- Kovačević, J., Popović, L. Č., & Dimitrijević, M. S. 2010, Mem. Soc. Astron. It. Suppl., 15, 176 [Google Scholar]
- Lalakos, A., Tchekhovskoy, A., Bromberg, O., et al. 2024, ApJ, 964, 79 [NASA ADS] [CrossRef] [Google Scholar]
- Li, Y.-J., Liao, N.-H., Sheng, Z.-F., et al. 2023, A&A, 676, A9 [NASA ADS] [CrossRef] [EDP Sciences] [Google Scholar]
- Luna-Cervantes, J., Tramacere, A., & Benítez, E. 2024, MNRAS, 532, 3729 [Google Scholar]
- Marin, F., Hutsemékers, D., Jiang, C. Z., et al. 2025, A&A, 695, A55 [NASA ADS] [CrossRef] [EDP Sciences] [Google Scholar]
- Marscher, A. P., Jorstad, S. G., D’Arcangelo, F. D., et al. 2008, Nature, 452, 966 [Google Scholar]
- Marziani, P., Dultzin, D., Sulentic, J. W., et al. 2018, Front. Astron. Space Sci., 5, 6 [CrossRef] [Google Scholar]
- Massaro, E., Maselli, A., Leto, C., et al. 2015, Ap&SS, 357, 75 [Google Scholar]
- Mineshige, S., Kawaguchi, T., Takeuchi, M., & Hayashida, K. 2000, PASJ, 52, 499 [NASA ADS] [CrossRef] [Google Scholar]
- Miniutti, G., Saxton, R. D., Rodríguez-Pascual, P. M., et al. 2013, MNRAS, 433, 1764 [NASA ADS] [CrossRef] [Google Scholar]
- Murdoch, H. S., Hunstead, R. W., & White, G. L. 1984, PASA, 5, 341 [Google Scholar]
- Netzer, H. 2019, MNRAS, 488, 5185 [NASA ADS] [CrossRef] [Google Scholar]
- Olguín-Iglesias, A., Kotilainen, J., & Chavushyan, V. 2020, MNRAS, 492, 1450 [Google Scholar]
- Osterbrock, D. E., & Koski, A. T. 1976, MNRAS, 176, 61P [NASA ADS] [CrossRef] [Google Scholar]
- Osterbrock, D. E., & Pogge, R. W. 1985, ApJ, 297, 166 [Google Scholar]
- Padovani, P., Alexander, D. M., Assef, R. J., et al. 2017, A&ARv, 25, 2 [Google Scholar]
- Paliya, V. S., Stalin, C. S., Domínguez, A., & Saikia, D. J. 2024, MNRAS, 527, 7055 [Google Scholar]
- Pogge, R. 2003, Are there any true Seyfert 2 nuclei?, Chandra Proposal ID 05700639 [Google Scholar]
- Pogge, R. W. 2011, in Narrow-Line Seyfert 1 Galaxies and their Place in the Universe, eds. L. Foschini, M. Colpi, L. Gallo, et al., 2 [Google Scholar]
- Ricci, C., & Trakhtenbrot, B. 2023, Nat. Astron., 7, 1282 [Google Scholar]
- Riess, A. G., Yuan, W., Macri, L. M., et al. 2022, ApJ, 934, L7 [NASA ADS] [CrossRef] [Google Scholar]
- Sądowski, A., Narayan, R., McKinney, J. C., & Tchekhovskoy, A. 2014, MNRAS, 439, 503 [CrossRef] [Google Scholar]
- Schmitt, H. R., Pringle, J. E., Clarke, C. J., & Kinney, A. L. 2002, ApJ, 575, 150 [NASA ADS] [CrossRef] [Google Scholar]
- Shakura, N. I., & Sunyaev, R. A. 1973, A&A, 24, 337 [NASA ADS] [Google Scholar]
- Shapovalova, A. I., Popović, L. Č., Burenkov, A. N., et al. 2012, ApJS, 202, 10 [NASA ADS] [CrossRef] [Google Scholar]
- Shaw, M. S., Romani, R. W., Cotter, G., et al. 2012, ApJ, 748, 49 [CrossRef] [Google Scholar]
- Sulentic, J. W., Marziani, P., Zamanov, R., et al. 2002, ApJ, 566, L71 [NASA ADS] [CrossRef] [Google Scholar]
- Sulentic, J. W., Marziani, P., & Zamfir, S. 2009, New Astron. Rev., 53, 198 [CrossRef] [Google Scholar]
- Tody, D. 1986, in Instrumentation in astronomy VI, ed. D. L. Crawford, SPIE Conf. Ser., 627, 733 [Google Scholar]
- Tody, D. 1993, in Astronomical Data Analysis Software and Systems II, eds. R. J. Hanisch, R. J. V. Brissenden, & J. Barnes, ASP Conf. Ser., 52, 173 [Google Scholar]
- Trakhtenbrot, B., & Netzer, H. 2012, MNRAS, 427, 3081 [NASA ADS] [CrossRef] [Google Scholar]
- Urry, C. M., & Padovani, P. 1995, PASP, 107, 803 [NASA ADS] [CrossRef] [Google Scholar]
- Veilleux, S., & Osterbrock, D. E. 1987, ApJS, 63, 295 [Google Scholar]
- Wang, J.-M., Szuszkiewicz, E., Lu, F.-J., & Zhou, Y.-Y. 1999, ApJ, 522, 839 [NASA ADS] [CrossRef] [Google Scholar]
- Whittle, M. 1992, ApJS, 79, 49 [Google Scholar]
- Zamfir, S., Sulentic, J. W., Marziani, P., & Dultzin, D. 2010, MNRAS, 403, 1759 [NASA ADS] [CrossRef] [Google Scholar]
- Zhang, X.-G., & Feng, L.-L. 2017, MNRAS, 468, 620 [Google Scholar]
Appendix A: Fitting parameters and classification
Fitting parameters with the corresponding uncertainties, classifications, physical parameters, and measured redshift.
Appendix B: Plots
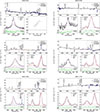 |
Fig. B.1. Spectra of the considered sources. Top panels: Redshift-corrected spectra with continuum and iron line fits overlaid. Dotted gray rectangles indicate the regions that are magnified in the lower panels, where detailed line fitting is performed. Bottom panels: Fitted emission lines (e.g., Hβ–[O III]λλ4959,5007 or Mg IIλ2800–[O II]λ3727), along with the corresponding residuals. Continued on the next page. |
Appendix C: Optically confirmed γ-ray detected NLS1s
γ-NLS1s with the corresponding coordinates and the most recent reference for the classification.
All Tables
Fitting parameters with the corresponding uncertainties, classifications, physical parameters, and measured redshift.
γ-NLS1s with the corresponding coordinates and the most recent reference for the classification.
All Figures
|
Fig. 1. Distribution of different source classes in the 4FGL catalog. Percentages indicate the updated number of objects in each class, based on Foschini et al. (2022) and revised according to the analysis presented in this work and other recent studies. Specifically, 2980 sources are from Foschini et al. (2022), 2 (J0105+1912 and J0933−0013) are from Paliya et al. (2024), and 1 (J0959+4600) is from Li et al. (2023). |
| In the text | |
|
Fig. 2. FWHM(Hβbroad)–R4570 plane that defines the quasar MS. Pop. A and B are shown, together with their finer subdivisions. Shaded regions indicate the areas populated by quasars, with the color intensity representing the source density in each region. The pink points represent the objects in the current sample for which the FWHM(Hβbroad) and R4570 were measured. |
| In the text | |
|
Fig. B.1. Spectra of the considered sources. Top panels: Redshift-corrected spectra with continuum and iron line fits overlaid. Dotted gray rectangles indicate the regions that are magnified in the lower panels, where detailed line fitting is performed. Bottom panels: Fitted emission lines (e.g., Hβ–[O III]λλ4959,5007 or Mg IIλ2800–[O II]λ3727), along with the corresponding residuals. Continued on the next page. |
| In the text | |
Current usage metrics show cumulative count of Article Views (full-text article views including HTML views, PDF and ePub downloads, according to the available data) and Abstracts Views on Vision4Press platform.
Data correspond to usage on the plateform after 2015. The current usage metrics is available 48-96 hours after online publication and is updated daily on week days.
Initial download of the metrics may take a while.