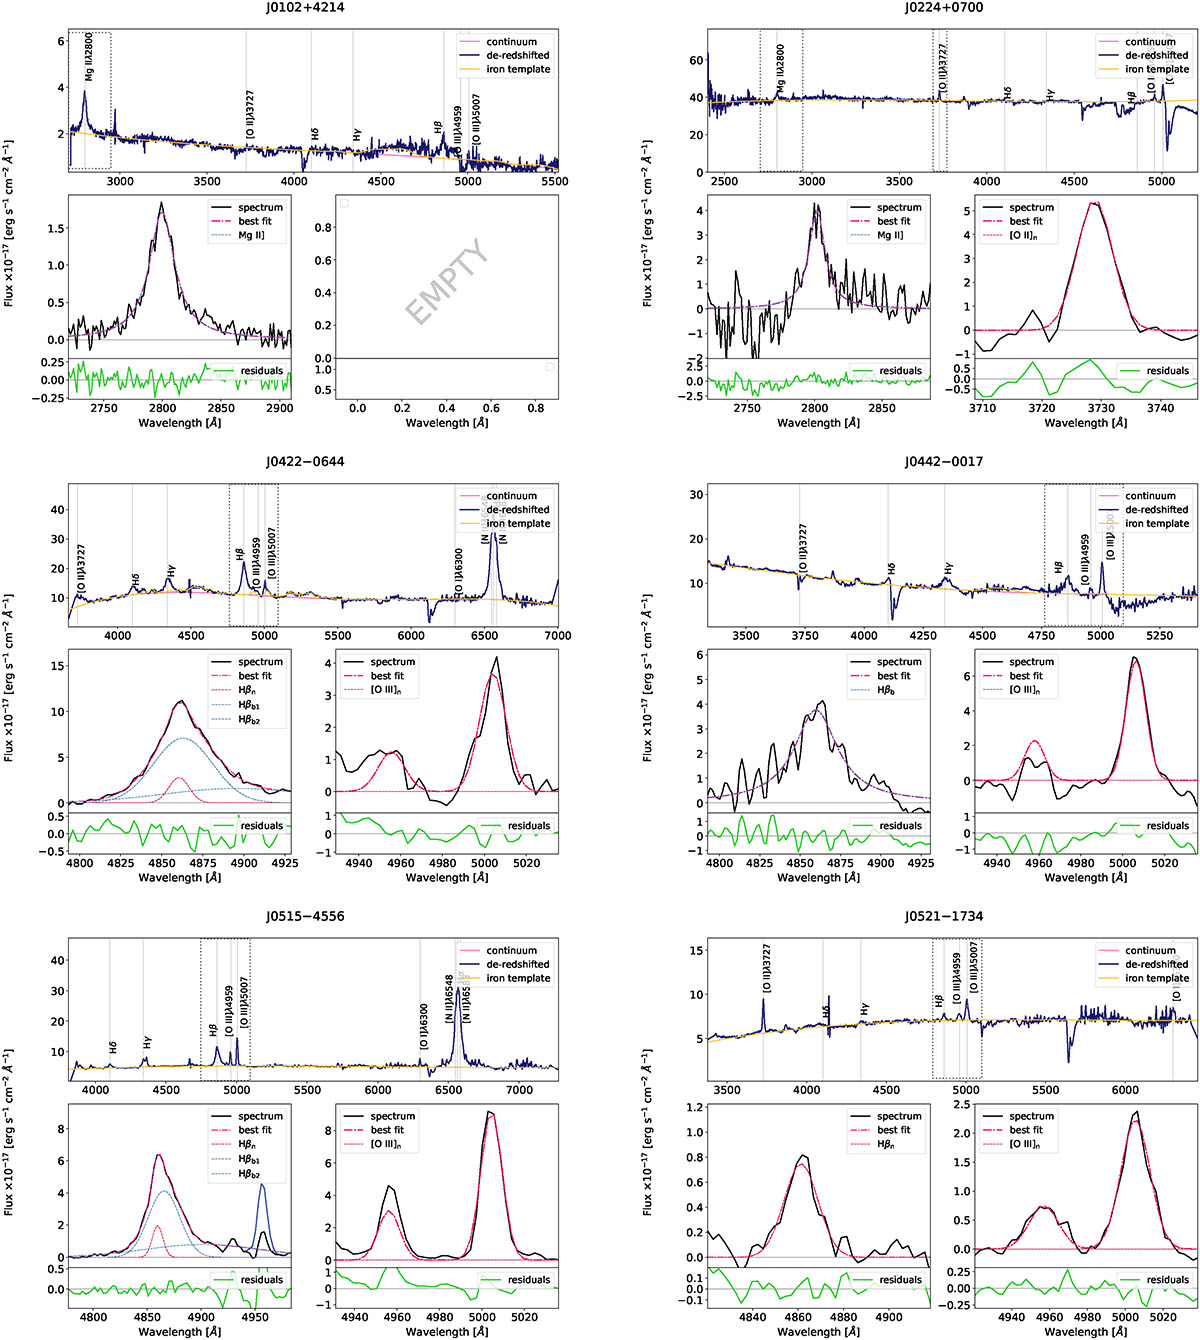
Fig. B.1.
Download original image
Spectra of the considered sources. Top panels: Redshift-corrected spectra with continuum and iron line fits overlaid. Dotted gray rectangles indicate the regions that are magnified in the lower panels, where detailed line fitting is performed. Bottom panels: Fitted emission lines (e.g., Hβ–[O III]λλ4959,5007 or Mg IIλ2800–[O II]λ3727), along with the corresponding residuals. Continued on the next page.
Current usage metrics show cumulative count of Article Views (full-text article views including HTML views, PDF and ePub downloads, according to the available data) and Abstracts Views on Vision4Press platform.
Data correspond to usage on the plateform after 2015. The current usage metrics is available 48-96 hours after online publication and is updated daily on week days.
Initial download of the metrics may take a while.