Fig. 10.
Download original image
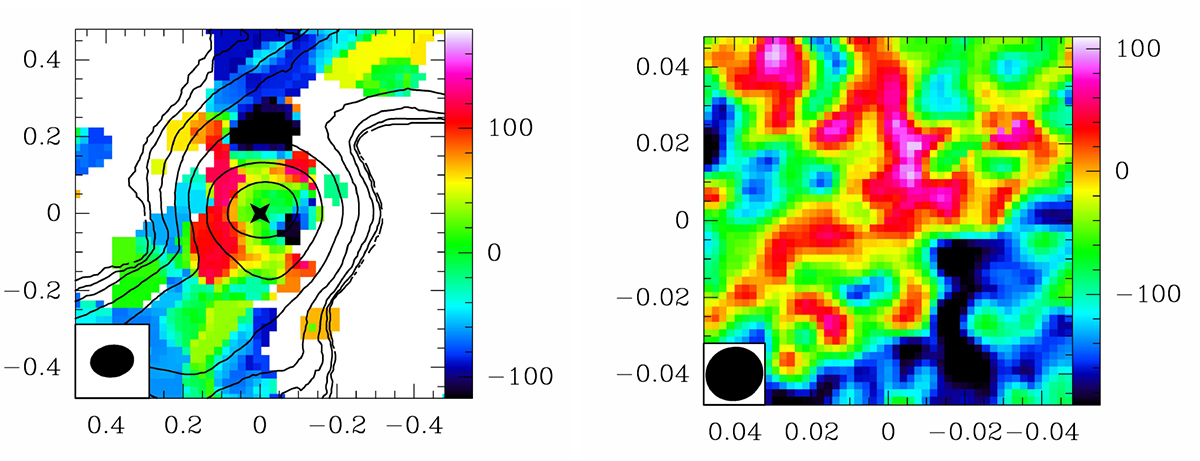
Velocity map of the NGC 613 CO(3–2) line residuals, once the spectra have been fit by a Gaussian, inside the range −150 to 150 km s−1, first at low resolution (left) and then at high resolution (right). Note that the field of view is different in the two panels (1″, and 0.1″, respectively). The contours of the CO(3–2) map at low resolution are overlaid in the left panel. The scale is RA-Dec offset in ″. The color scale is in km s−1.
Current usage metrics show cumulative count of Article Views (full-text article views including HTML views, PDF and ePub downloads, according to the available data) and Abstracts Views on Vision4Press platform.
Data correspond to usage on the plateform after 2015. The current usage metrics is available 48-96 hours after online publication and is updated daily on week days.
Initial download of the metrics may take a while.