| Issue |
A&A
Volume 705, January 2026
|
|
|---|---|---|
| Article Number | A124 | |
| Number of page(s) | 13 | |
| Section | Extragalactic astronomy | |
| DOI | https://doi.org/10.1051/0004-6361/202557190 | |
| Published online | 13 January 2026 | |
High-resolution mapping of molecular tori with ALMA
1
Observatoire de Paris, LUX, Collège de France, CNRS, PSL University, Sorbonne University 75014 Paris, France
2
Instituto de Astrofísica de Canarias, Vía Láctea S/N E-38205 La Laguna, Spain
3
Departamento de Astrofísica, Universidad de La Laguna E-38206 La Laguna, Spain
4
Observatorio Astronómico Nacional (OAN-IGN)-Observatorio de Madrid, Alfonso XII 3 28014 Madrid, Spain
5
INAF – Osservatorio Astrofisico di Arcetri Largo Enrico Fermi 5 I-50125 Firenze, Italy
6
Department of Space, Earth and Environment, Chalmers University of Technology, Onsala Space Observatory 439 92 Onsala, Sweden
7
INAF – Istituto di Radioastronomia Via P. Gobetti 101 40129 Bologna, Italy
8
Section of Astrophysics, Astronomy, and Mechanics, Department of Physics, National and Kapodistrian University of Athens, Panepistimioupolis Zografou 15784 Athens, Greece
9
Physikalisches Institut, Universität zu Köln Zülpicher Str. 77 50937 Cologne, Germany
10
Max-Plank-Institut für Radioastronomie, Max-Planck-Gesellschaft Auf dem Hügel 69 53121 Bonn, Germany
11
Institut de Radioastronomie Millimétrique (IRAM) 300 Rue de la Piscine 38400 Saint-Martin-d’Hères, France
12
European Southern Observatory, Alonso de Córdova 3107 Vitacura Santiago 763-0355, Chile
13
Joint ALMA Observatory, Alonso de Córdova 3107 Vitacura Santiago 763-0355, Chile
14
Institute of Astronomy and Astrophysics, Academia Sinica, 11F of AS/NTU Astronomy-Mathematics Building, No.1, Sec. 4 Roosevelt Rd Taipei 106319, Taiwan
15
Leiden Observatory, Leiden Univ. PO Box 9513 2300 RA Leiden, The Netherlands
16
Transdisciplinary Research Area (TRA) ‘Matter’/Argelander-Institut für Astronomie, University of Bonn Bonn, Germany
★ Corresponding author: This email address is being protected from spambots. You need JavaScript enabled to view it.
Received:
10
September
2025
Accepted:
10
November
2025
Abstract
Recent high-resolution mapping of the circumnuclear regions of active galactic nuclei (AGNs) has revealed the existence of geometrically thin nuclear disks, in general randomly oriented with respect to their galaxy hosts. These molecular tori have typical radii of 10 pc, and contain a few 107 M⊙ of H2, with H2 column densities between 1023 and 1025 cm−2. We mapped two of the most massive of these molecular tori with a higher resolution, in order to unveil their morphology and kinematics, their possible warp and clumpiness, and derive their stability and lifetime. We used the highest resolution possible with ALMA (16 km baseline) in Band 7, taking into account for mapping CO(3–2) and HCO+(4–3) the compromise between sensitivity and resolution. New features are discovered at the high resolution, obtained with a beam of 0.015″, equivalent to ∼1 pc scale, at their ∼15 Mpc distance. The molecular torus in NGC 613 appears similarly to a ring, depleted in molecular gas near the center. The depletion region is displaced by 3 pc toward the NW from the AGN position, meaning some m = 1 asymmetry in the torus. The molecular torus in NGC 1672 has a different position angle from previous lower-resolution observations, and is edge-on, revealing a geometrically very thin torus (axis ratio 6.5–10), with a clear warp. This confirms that the classical model of a simple geometrically thick dusty torus is challenged by high-resolution observations. The nuclear disks appear to be clumpy, and slightly lopsided. The molecular outflow in NGC 613 is now resolved out. Well inside the sphere of influence of the black holes (BH), we are now able to determine more accurately their mass, for those Seyfert spiral galaxies, in a region of the M-sigma relation where the scatter is maximum.
Key words: galaxies: active / galaxies: ISM / galaxies: individual: NGC613 / galaxies: individual: NGC1672 / galaxies: kinematics and dynamics / galaxies: nuclei
© The Authors 2026
 Open Access article, published by EDP Sciences, under the terms of the Creative Commons Attribution License (https://creativecommons.org/licenses/by/4.0), which permits unrestricted use, distribution, and reproduction in any medium, provided the original work is properly cited.
This article is published in open access under the Subscribe to Open model. This email address is being protected from spambots. You need JavaScript enabled to view it. to support open access publication.
1. Introduction
One of the essential issues in galaxy evolution is to understand how active galaxy nuclei (AGNs) are fueled, and how they regulate star formation. In recent years, observations at 100 pc scales of the molecular gas have brought great progress in the question of how AGNs are fueled dynamically in galaxies (e.g. García-Burillo et al. 2005, 2021, 2024; Combes et al. 2013, 2014; Goesaert et al. 2025), and how the energy generated by the AGN can, in turn, regulate its gas accretion, through molecular outflows (e.g. Cicone et al. 2014; García-Burillo et al. 2014; Fiore et al. 2017; Fluetsch et al. 2019; Lutz et al. 2020; Gorski et al. 2024; Esposito et al. 2024). This star formation regulation between feeding and feedback is well illustrated in numerical simulations of embedded bars, spirals, and m = 1 instabilities (e.g. Hopkins & Quataert 2010; Combes 2012; Hopkins et al. 2024), and also corresponding feedback (Dubois et al. 2013; Gabor & Bournaud 2014; Ward et al. 2022; Koudmani et al. 2022). ALMA has recently mapped in molecular lines and dust continuum some molecular tori, a key element in the AGN unification paradigm (e.g. García-Burillo et al. 2016, 2019; Combes et al. 2019; Impellizzeri et al. 2019; Kameno et al. 2020; Imanishi et al. 2020; Uzuo et al. 2021; Alonso Herrero et al. 2023). After having mapped the nuclear regions of several nearby Seyferts with a resolution of a few tens of parsecs, our view of molecular tori is more complex than the iconic model brought by optical, X-ray, and radio observations (e.g. Antonucci & Miller 1985; Urry & Padovani 1995). The torus might be unstable, warped, and decoupled from larger scales. The 10 pc scale is a pivotal region of transition between the gas being driven to the center dynamically to feed the nucleus, and the AGN feedback on the host galaxy, via molecular outflows.
These 10 pc scales are the frontiers separating the broad-line regions (BLRs) from the narrow-line regions (NLRs), the main components observed for decades in the optical AGN spectra. The torus is supposed to obscure the BLR in type 2 AGNs, and is believed to collimate the AGN radiation, which produces a biconical structure (e.g. Malkan et al. 1998). Therefore, dust in this NLR region is observed with a polar structure (Gratadour et al. 2015; Asmus et al. 2016; Leftley et al. 2019; Asmus 2019; Haidar et al. 2024). Multiwavelength data have converged to provide clues on the circumnuclear obscuring structure (e.g. Ramos Almeida & Ricci 2017; Hönig 2019). The expected torus is so small (1–30 pc in size) that it was impossible to see it until recently, where we have detected for the first time CO(6–5) emission in a 10 pc-diameter torus in the Seyfert 2 NGC 1068 with ALMA (García-Burillo et al. 2016). Imanishi et al. (2016) found there to be strong HCO+ and HCN emissions, tracing dense gas.
In the present work, we report high-spatial-resolution (1 pc) mapping of the molecular gas through the CO(3–2) line, in two spiral galaxies, where dense molecular tori were found (Combes et al. 2019), in order to further analyze their morphology and kinematics. The paper is structured as follows. Our sample is briefly described in Sect. 2. Section 3 presents the details of ALMA observations. The morphology and kinematics results are quantified in Sect. 4. We discuss in Sect. 5 the inferences on feeding and feedback processes for these low-luminosity AGNs. Section 6 summarizes our conclusions. Throughout the present paper, the velocity scale is defined with respect to redshifts indicated in Table 1, if not mentioned otherwise. With the distances adopted in Table 1, 1″ = 83 pc and 55 pc for NGC 613 and NGC 1672, respectively.
Targets’ physical parameters.
2. The sample
The galaxies being studied are two of the most gas-concentrated objects in the NUGA (NUclei of GAlaxies) sample of nearby low-luminosity AGNs, of which a large fraction are barred galaxies (e.g. García-Burillo et al. 2003; Casasola et al. 2011). They were observed with ALMA covering different tracers (CO(3–2), CO(6–5), CI, and dense gas tracers, such as HCN(4–3), HCO+(4–3), and CS(7–6)), and a large range of spatial resolutions. Our main goal is to study the dynamics and structures in the central kiloparsec down to the sphere of influence (SoI) of the black hole (BH; with the highest resolution of 1 pc), tracing the kinematics in the galaxy disks, possible bars and nuclear rings, computing gravity torques to understand the fueling mechanisms, and tracking feedback outflows (Combes et al. 2013, 2014, 2019; Audibert et al. 2019, 2021).
NGC 613 is a typical barred spiral with an inner Lindblad resonance (ILR) ring of radius 3.5″ or 300 pc, and inside the ring, a circumnuclear disk (CND) of radius 1″ = 83 pc. Miyamoto et al. (2017) found a radio continuum jet at 95 GHz (PA = 20°) corresponding to the radio-centimeter jet (Hummel & Jorsater 1992). Audibert et al. (2019) have detected a nuclear molecular outflow (size ∼ 25 pc) along the jet, and the molecular torus is located inside a nuclear trailing spiral, fueling the nucleus. The main disk is rather face-on (i = 36°, PA = 122° from HyperLeda, see reference link in the acknowledgements), while the torus is kinematically decoupled and conspicuous in CO(3–2) and HCO+(4–3) (Audibert et al. 2019). Water masers are present in the nucleus (Kondratko et al. 2006).
NGC 1672 is a strongly barred Sy2 with high global star formation activity: SFR = 2.7 M⊙/yr (Kewley et al. 2000). The AGN is hidden in a Compton-thick nucleus (de Naray et al. 2000). Chandra detected a hard X-ray emission in the nucleus (Jenkins et al. 2011). Inside the ILR nuclear ring of radius 5″ = 275 pc, some thin filaments join to the torus, kinematically decoupled from the galaxy, with a large velocity gradient inside 100 pc. While the main galaxy disk is almost face-on (i = 29°, PA = 155° from HyperLeda), the torus appears much more inclined (i = 66°, PA = 90°; Combes et al. 2019). We summarize the galaxy properties in Table 1.
3. Observations and data analysis
The observations were carried out with the ALMA interferometer in cycle 7, with 38–48 antennas, during September 2021. The corresponding ALMA project ID was 2019.1.00273.S with PI F. Combes. Two galaxies (NGC 613 and NGC 1672) were observed simultaneously in CO(3–2), HCO+(4–3), and continuum, with Band 7 (Mahieu et al. 2012). The extended configuration (baselines between 122 m to 16.2 km) used resulted in a synthesized beam of 0.015–0.012″ (0.8–1.2 pc for NGC 1672 and NGC 613, respectively), and a root-mean-square (rms) sensitivity of ∼0.4 mJy beam−1 in 5.7 km s−1 channels (19 μJy beam−1 in the 3.7 GHz band of the continuum). The maximum recoverable scale is 0.24″ (13 and 20 pc for NGC 1672 and NGC 613, respectively). Each galaxy was observed during three periods of about 42 min on source. The total integration time, including calibration and overheads, was 6 h per source. The choice of correlator configuration, selected to simultaneously observe two lines, provided a velocity range of 1350 km s−1 for each line.
The flux calibration was done with nearby quasars, which are regularly monitored at ALMA, and resulted in a nominal 10% accuracy. The data were first calibrated with the CASA software, using the scriptForPI and the version 6.2.1.7 (McMullin et al. 2007). Then the analysis was finalized, through imaging and cleaning with the GILDAS software (Guilloteau et al. 2000). The final cubes at high resolution are at the maximum 6250 × 6250 pixels with 2.9 mas per pixel in the plane of the sky, and have 236 channels that are 6.77 MHz = 5.9 km s−1 in width. Although these maps cover the Full Width at Half Maximum (FWHM) primary beam of 18″, they show signals only in the very center, due to the decreasing signal to noise ratio with distance from the nucleus. The spectral windows spw19 (342 GHz) and spw21 (364 GHz) served to compute the continuum, and were subtracted in the UV plane from the spw25 (the CO(3–2) line) and spw27 (the HCO+(4–3) line). The CO(3–2) maps were made with Briggs weighting and a robustness parameter of 0.5, i.e., a trade-off between uniform and natural weighting. The HCO+(4–3) maps, due to lower signal-to-noise ratio, were done with natural weighting, resulting in a beam of 0.018–0.019″. The data were cleaned using a mask made from the integrated CO(3–2) map. The final maps were corrected for primary beam attenuation. Because of missing short spacings, the interferometer does not detect smooth and extended emission, with scales larger than ∼0.24″, in each channel map. The scales between 0.24 and 3″ were mapped correctly with our previous configurations, and flux comparisons to check for missing flux are reported in the next section. If the large velocity gradients prevent the line maps from being too affected, the missing-flux problem is more severely affecting continuum maps.
4. Results
4.1. Continuum maps
The continuum maps at 0.86 mm of the central regions of the two galaxies are displayed in Fig. 1. The signal is weak, since the long baselines filter out most of the signal. This means that the continuum emission is resolved. The continuum is weaker in NGC 1672, and the map was obtained in the natural weighting mode, while for NGC 613 we used the robust mode. The resulting beams are 14 × 13 mas, PA = −72° for NGC 613, and 22 × 19 mas, PA = 10° for NGC 1672. The peak continuum is 0.15 mJy beam−1 (7.5σ) and 0.10 mJy beam−1 (5σ), respectively, for the two galaxies. At low resolution, it was 2 mJy beam−1 for a beam of 0.2″ in NGC 613 and 0.2 mJy beam−1 for a beam of 0.1″ in NGC 1672. Taking into account the different beam areas, it is difficult to estimate the exact flux lost, since the signal-to-noise does not allow us to map the wider beam, and the missing flux depends on the flux spatial distribution, which is extended for both resolutions. It is clear, however, that the missing flux is higher in proportion than for the line (Sect. 4.2).
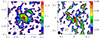 |
Fig. 1. Continuum map at 0.86 mm of the NGC 613 (left) and NGC 1672 (right) nucleus. The spatial scale is RA-Dec offset in arcsec from the central position of Table 1. The color scale is in milliJansky beam−1. The first contour is at 2σ, and the next contours are spaced by 1σ (see Sect. 4.1 for the value of σ). The AGN center is indicated by a black cross, and the bar at bottom left is 1 pc long. A red arrow indicates the jet direction in NGC 613. |
In the NGC 613 galaxy, Miyamoto et al. (2017) find in the center a radio jet with PA = 20° at 95 GHZ, parallel to the VLA one at 4.9 GHz (Hummel & Jorsater 1992), but the nuclear emission is not resolved at 350 GHz with their beam of 0.44″. The nuclear continuum emission was partially resolved by Audibert et al. (2019) with the 0.2″ beam and is extended in the SE direction, suggesting the association with the nuclear spiral. At a much smaller scale, with a total extension of 50 mas, We might see here the beginning of the jet, but with the somewhat different position angle of PA = 50°. The weaker NGC 1672 continuum is also resolved, and might have an extension of 40 mas.
It is not possible to disentangle the possible dust thermal contribution, from the synchrotron emission, and for the latter the contribution of the radio jet and that of star formation. However, we may note that the continuum is much less extended than the molecular torus, suggesting that the thermal dust emission from the torus is not dominating. The continuum is centered at the same position as the AGN location, given in Table 1 within the beam of ∼0.1″ (Combes et al. 2019).
When taking into account higher-frequency observations for CI and CO(6–5) (Audibert et al., in prep.), it is possible to infer that the dust emission is not dominating in both galaxies. At 690 GHZ, and a beam of 0.05×0.04″, the continuum of NGC 1672 is not detected. In NGC 613, the continuum is detected at 690 GHZ, and is 3 mJy beam−1 with the same beam. However, it is not detected at 492 GHZ (< 0.5 mJy beam−1), with this same beam, suggesting that the synchrotron dominates.
4.2. CO(3–2) line maps: Morphology
Figures 2 and 3 display the morphology of the molecular gas at high resolution, with the zeroth-moment of the CO(3–2) line emission, compared with what was obtained at the lower resolution of 0.2″, on the two galaxies NGC 613 and NGC 1672. The beam at high resolution is ∼13 times smaller than that at low resolution, combining all previous observations with more compact configurations. The new maps unveil many unexpected details. In NGC 613, the molecular torus, inside the nuclear spiral, appears as a ring depleted in its center, more exactly displaying a hole in the NW direction, in both CO and HCO+ lines. One possible interpretation is that the molecular torus is subject to an m = 1 lopsided mode, and the present hole corresponds to a previous strong AGN episode, which has ejected its surrounding gas. The torus is rather clumpy, and linked with two nascent spiral arms to the largest nuclear structure. In NGC 1672, what was thought to be an i = 66°-inclined molecular torus, decoupled from the rest of the galaxy disk with PA = 90°, is now split in two components. The main nuclear molecular torus is quite edge-on, with a PA = 70°, and is warped at its two extremities. The NE side is more extended, and its orientation tends toward the north axis. The clumpiness of molecular tori has been modeled already to explain their spectral dust properties (e.g. Nenkova et al. 2008; Hönig & Kishimoto 2010). Figure 5 display schematic cartoons to better identify the various components in both galaxies.
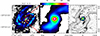 |
Fig. 2. Low resolution (but without the most compact configurations) at ∼0.1″ (left), zoomed in on the middle and high resolution at ∼0.015″ (right) of the CO(3–2) surface density toward NGC 613. The left and middle moment-0 maps have been integrated over a velocity range −175 to 175 km s−1, and with a threshold of 2.3 mJy beam−1. In the right panel, the CO(3–2) contours of the low-resolution map are overlaid. While the left panel is plotted in absolute coordinates, the spatial scales of the two others are RA-Dec offsets in arc seconds, from the center of Table 1. The color scale is in Jy beam−1 km s−1. |
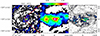 |
Fig. 3. Same as Fig. 2 but for NGC 1672, with a different color bar. The left and middle moment-0 maps have been integrated over a velocity range from −200 to 200 km s−1, and with a threshold of 4 mJy beam−1. The color scale is in Jy beam−1 km s−1. |
Sizes: The high resolution enables us to distinguish the actual circumnuclear components, that were not resolved before. In NGC 613, the true molecular torus has a radius of 0.1″ = 8 pc, about twice smaller than previously determined (Combes et al. 2019). There is a depleted “hole” near the center of a beam size, i.e., a radius of 0.5 pc. The hole is offset to the NW of the center, by 36 mas = 3 pc. This means some lopsidedness in the torus. The starting spiral arms span a total diameter of 50 pc, before merging into the nuclear spiral. In NGC 1672, the actual edge-on molecular torus has a radius of 0.13″ = 7 pc, nearly four times smaller than previously identified. This is, however, the straight part of this edge-on structure, which extends through its NE warp to a radius of ∼14 pc. The molecular torus is embedded in a wider structure, kinematically decoupled, and more face-on, with a radius of 0.8″ = 44 pc. This latter structure corresponds to the unresolved central region conspicuous in [FeII] and H2(1–0)S(1), tracing the AGN excitation (Fazeli et al. 2020). This structure is then rather isolated at the center of the inner Lindblad resonance ring at a radius of 5″ = 275 pc, which is actively forming stars (Jenkins et al. 2011).
Masses: To derive the H2 mass of observed components, we computed L′CO, the CO luminosity in units of K km s−1 pc2, with the integrated emission in the beam. This CO luminosity is given by
 (1)
(1)
where SCOdV is the integrated flux in Jy km s−1, νrest the rest frequency in GHz, and DL the luminosity distance in Megaparsec. Under the assumption of a standard CO-to-H2 conversion factor (Bolatto et al. 2013), we computed the H2 mass using M(H2) = α L′CO, with α = 4.36 M⊙ (K km s−1 pc2)−1. This relation was calibrated for the fundamental CO(1–0) line, but should also be valid for any higher J level, provided LTE excitation at high kinetic temperatures. However, the higher levels are sub-thermally excited in galaxies, and we adopted the R1J = T1/TJ empirical correction ratios from Tacconi et al. (e.g. 2018), that is for CO(3–2) R13 = 1.8. The molecular gas mass estimates for the two galaxies are presented in Tables 2 and 3.
Comparison of low- and high-resolution CO(3–2) central 0.2″ fluxes.
Derived quantities for the molecular tori of the two galaxies.
The maximum observed H2 column densities derived in Table 3 imply that the two nuclei are Compton-thick. This means that the strongest X-ray sources, observed toward the nuclei, could be due to the active AGN, while there was some debate around the nature of these sources in NGC 613 (Castangia et al. 2013) and in NGC 1672 (de Naray et al. 2000; Jenkins et al. 2011).
To quantify whether we were missing flux in the central region of the galaxies, we compared the central beam spectrum of the previous maps, all configurations combined, resulting in a beam of 0.2″. We integrated the new high-resolution CO(3–2) maps over this region; the comparisons are plotted in Fig. 4 for NGC 613 (left panel) and NGC 1672 (right panel), respectively. We conclude from the quantification of Table 2 resulting from Gaussian fits that the missing flux is variable, according to the concentration of the molecular gas. From the integrated areas, it is 9% for NGC 613 and 45% for NGC 1672.
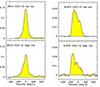 |
Fig. 4. Comparison of the total spectrum within a circle of 0.2″ in diameter between the high-resolution CO(3–2) observation of NGC 613 (left, bottom) and low resolution (left, top). Same for NGC 1672 at right. The vertical scale is the flux in Jansky. The involved aperture is much larger than the torus here. |
4.3. CO(3–2) line: Kinematics
Figures 6 and 7 show the three first moments of the NGC 613 and NGC 1672 cubes. For the NGC 613 galaxy, the velocity field now shows a clear decoupling from the host disk, with a kinematic position angle of PA = −20°. This PA also corresponds to the elongated shape of the zeroth-moment, which appears like an ellipse, somewhat truncated at the SE extremity. From this oval shape, an assuming a circular torus, an inclination of 50° can be derived. There is a strong velocity gradient toward the center, and this is reflected in the second moment, where the velocity dispersion appears to maximize near the major axis, up to 300 km s−1.
For the NGC 1672 galaxy, the central velocity field is more complex since there is a superposition of two components, with different inclinations on the line of sight. However the velocity gradient of the edge-on molecular torus is very clear, and quite decoupled from the other more face-on (i = 68°) component. The molecular torus has a kinematical PA = 70°, more perpendicular to the large-scale PA = 124° of the galaxy disk (Díaz et al. 1999). Since the galaxy is less distant, the beam can better resolve the strong velocity gradient toward the center, and the apparent velocity dispersion in the second moment map maximize at only 200 km s−1.
4.3.1. Molecular gas outflow
A molecular outflow was discovered at low spatial resolution in NGC 613 (Audibert et al. 2019). The molecular outflow mass was Mout = 2 × 10⁶ M⊙ and the mass outflow rate 27 M⊙/yr. The outflow was observed in the same direction as the radio jet mapped with the VLA, suggesting that the gas was entrained by the jet. With the present higher-resolution observations, we detect clearly broad wings on each side of the central spectrum, in Fig. 8. The total observed spectrum extends to 650 km s−1 on each side and does not show any more signal beyond ±500 km s−1. However, the red wing is contaminated by the H13CN(4–3) line, at 345.340 GHz, situated at 396 km s−1 from the CO(3–2) line. The spectrum beyond 300 km s−1 therefore has to be ignored. In order to quantify the molecular outflow in the high-resolution map, we extracted the central 0.15″ × 0.15″ region, corresponding to 75 × 75 = 5625 pixels (2 mas per pixel), between velocity −500 and 300 km s−1, and fitted the main spectral component between −150 and 150 km s−1 by a Gaussian. Removing the Gaussian fit from every pixel, we mapped the residual emission, where the maximum integrated flux was 10 times lower than the original map. The velocity field of this residual map still indicates redshift in the north and blueshift in the south (see Fig. 10, right panel). There is no evidence of the outflow, in this high-resolution map. The previously identified outflow shows a blue wing in the NE and a red wing in the SW. The outflow velocities are opposite to the rotation velocities, also with a different position angle, which helps to reduce the confusion between the two components.
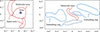 |
Fig. 5. Cartoons to identify the principal components in NGC 613 (left) and NGC 1672 (right). For NGC 613, there is an H2O maser detected in the (0,0) nucleus position (Kondratko et al. 2006; Castangia et al. 2008). The scales are RA-Dec offsets in arc seconds. The AGN centers are indicated by faint crosshairs. |
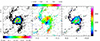 |
Fig. 6. Moment zero (left), one (middle), and two (right) of the CO(3–2) cube with 0.015″ beam toward NGC 613. An H2O maser has been detected coinciding with the (0,0) position (Kondratko et al. 2006; Castangia et al. 2008). The color scale to the left is in Jy beam−1 km s−1. The moments have been integrated over a velocity range from −300 to 300 km s−1, and with a threshold of 0.6 mJy beam−1. In the middle, the color scale is in velocity difference from the Vsys = 1481 km s−1. On the right the color scale is given in km s−1. The synthesized beam is shown in the bottom left corner of right box. The spatial scales are RA-Dec in arc seconds, from the central position reported in Table 1. |
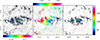 |
Fig. 7. Same as Fig. 6 but for NGC 1672. The moments have been integrated over a velocity range from −250 to 250 km s−1, and with a threshold of 0.55 mJy beam−1. In the middle, the color scale is in velocity difference from the Vsys = 1331 km s−1. |
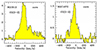 |
Fig. 8. CO(3–2) average spectrum from the high-resolution configuration of the 0.014″ central beam of NGC 613, showing high-velocity components (left), and of NGC 1672 (right). The vertical scale is Flux in milliJansky. |
The channel map of Fig. 9 confirms the velocity extension in particular on the redshifted side, even taking into account the H13CN(4–3) contamination in the two last positive channels. The absence of the outflow signature at these small scales may be due to the interferometer filtering the more extended features. To check this, we applied the same Gaussian fit technique as described above to the more extended CO(3–2) cube with all configurations included. The derived residual map now reveals the outflow, as is shown in the left panel of Fig. 10. This is consistent with the outflow derived previously by Audibert et al. (2019). The outflow is seen at a 25 pc scale, which is larger than the maximum recoverable scale of 20 pc with the high-resolution configuration. The broad wings of NGC 613 central spectra, now dominated by the rotation around the BH (see Sect. 4.3.2), were not dominant at low resolution, when the emission was dominated by gas at much larger scale.
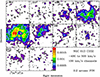 |
Fig. 9. Channel map in CO(3–2) of NGC 613. Each channel is 100 km s−1 wide, to show the high-velocity component with the same flux scale. The latter is in Jy beam−1, average over the channel velocity range. Each panel is 0.2″ in size. |
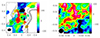 |
Fig. 10. Velocity map of the NGC 613 CO(3–2) line residuals, once the spectra have been fit by a Gaussian, inside the range −150 to 150 km s−1, first at low resolution (left) and then at high resolution (right). Note that the field of view is different in the two panels (1″, and 0.1″, respectively). The contours of the CO(3–2) map at low resolution are overlaid in the left panel. The scale is RA-Dec offset in ″. The color scale is in km s−1. |
The disappearing of the outflow at high resolution was also seen in NGC 1068 (GRAVITY Collaboration 2020; Gámez Rosas et al. 2025). This may be a generic property of these winds. If they are resolved out, this means that the wind is quite diffuse, with little small-scale structure. Alternatively, the multiphase outflow could be ionized only near the center (e.g. Alonso-Herrero et al. 2019; García-Bernete et al. 2021).
The outflow recovered in Fig. 10 is also consistent in orientation with the much larger-scale outflow (10″ or 1 kpc size) detected in the [OIII] line by Hummel et al. (1987). The excitation of the ionized gas in the outflow is mixed from both star formation and the AGN (Silva-Lima et al. 2025), and the outflow kinetic energy could also be due to the combination of several parameters acting together, AGN winds and jets, or feedback from massive stars.
There is no evidence of outflow in the center of NGC 1672. However, there is a radio source, unresolved with the 3 cm beam of ATCA of 1.3″ (Jenkins et al. 2011), associated with the AGN, which could correspond to a radio jet. There are no broad wings localized in the nucleus, as in NGC 613, perhaps because the molecular gas is not as concentrated (see Fig. A.1). This will be obvious in the next section, in the position-velocity diagram.
4.3.2. Black hole mass
With the high resolution of the 1 pc scale, our measurements of velocities are well within the SoI of the BHs, whatever their definition. A first definition SoI1 according to Merritt (2004) is the radius at which the enclosed mass is twice the BH mass, MBH. Another definition is SoI2 = G MBH/σv2, where σv is the central velocity dispersion of the stars, essentially the central bulge velocity dispersion. These values are 11–50 pc and 33–8.8 pc for NGC 613 and NGC 1672 respectively. Within 10 pc, the bulge mass was computed by Combes et al. (2019) from a mass model based on HST and Spitzer observations to be 2.7 and 4.1 × 10⁶ M⊙ for NGC 613 and NGC 1672, respectively. This means that we can get a good approximation of MBH by computing the enclosed mass, and subtracting these values.
The velocity gradient in the edge-on torus of NGC 1672 can be measured from the position-velocity diagrams in Fig. 11. There is a rotational velocity of 140 km s−1 at a radius of 0.2″ = 11 pc. For gas in a circular orbit, this means an enclosed mass of 5 × 10⁷ M⊙. The bulge mass inside 11 pc is 4.9 ×v106 M⊙, and we can derive MBH = 4.5 × 10⁷ M⊙. This value is consistent with previous determinations (e.g. Combes et al. 2019), well within the error bars. It is significantly larger than that derived from the M–σ relation of 2.5 × 10⁷ M⊙. This might be surprising, since we observe a comparable velocity gradient, but over a smaller distance, thanks to the higher resolution. However, in the previous model, we corrected the velocity for the inclination, and now the torus is edge-on. We also computed the contours of the position-velocity diagram, as was done in Combes et al. (2019), assuming circular orbits. These are displayed in the right panel of Fig. 11.
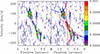 |
Fig. 11. Position–velocity diagram in CO(3–2) for NGC 1672, taken along the major axis of the torus, PA = 70°. The two panels are the same, with at right the superposition in blue of the circular velocity of the galaxy model with MBH = 4.5 × 10⁷ M⊙. The red contours are from the gas density of the torus model. The strip of length 2″ is centered on the galaxy at 1″. The color bar scale is Jansky beam−1. |
For NGC 613, the orientation of the torus of i = 50° allows us to ascertain that assuming circular orbits is a reasonable approximation. On the kinematic axis of PA = 160°, we can measure a projected rotation velocity of 250 km s−1 at 1 pc radius in Fig. 12. After correcting for the inclination, this leads to an enclosed mass of 3.4 × 10⁷ M⊙. While the bulge mass enclosed is estimated at 2.6 × 10⁴ M⊙, MBH = 3.4 × 10⁷ M⊙. This leads to a value perfectly consistent with previous estimates, and with that from the M–σ relation of 3.7 × 10⁷ M⊙ (Combes et al. 2019). Finally, the lack of resolution was nicely compensated by a correct modeling of the contribution of the other mass components, while at high resolution, the latter are not important. The BH masses are now more robust.
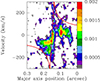 |
Fig. 12. Position–velocity diagram in CO(3–2) for NGC 613, taken along the major axis of the torus, PA = −20°. The circular velocity predicted in projection for MBH = 3.4 × 10⁷ M⊙ is superposed in red. The strip of length 0.3″ is centered on the galaxy at 0.15″. The color bar scale is Jansky beam−1. |
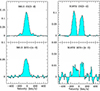 |
Fig. 13. Total spectra in the high-resolution configuration, integrated over the field of view containing emission, 0.6″ for NGC 613 (left) and 1.7″ for NGC 1672 (right), in CO(3–2) (top), and HCO+(4–3) (bottom). The vertical scale is the flux in Jansky. |
4.4. HCO+(4–3) line
One of the spectral windows was dedicated to the HCO+(4–3) line, a dense gas tracer, yielding some new information, although its intensity is ∼3–6 times lower than that of CO(3–2). The critical density to excite HCO+(4–3) is 1.8 × 106 cm−3 (Greve et al. 2009). Figures 14 and 15 display the three first moments of the HCO+(4–3) map in the galaxies NGC 613 and NGC 1672, respectively.
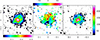 |
Fig. 14. Moment zero (left), one (middle), and two (right) of the HCO(4–3) cube with 0.019″ beam toward NGC 613. The moments have been integrated over a velocity range from −260 to 260 km s−1, and with a threshold of 2.2 mJy beam−1. In the middle, the color scale is in velocity difference from the Vsys = 1481 km s−1. The synthesized beam is shown in the bottom left corner of right box. The spatial scales are RA-Dec in arc seconds, from the central position reported in Table 1. |
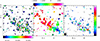 |
Fig. 15. Same as Fig. 14 but for NGC 1672. The moments have been integrated over a velocity range −260 to 260 km s−1, and with a threshold of 0.65 mJy beam−1. In the middle, the color scale is in velocity difference from the Vsys = 1331 km s−1. |
In the galaxy NGC 613, the molecular torus is very concentrated in the dense gas tracer, even more than in the CO(3–2) emission. The maximum in the HCO+(4–3) zeroth-moment map is in the core, with a value 0.47 Jy beam−1 km s−1, while in CO(3–2), the maximum value is a bit offset, with 0.32 Jy beam−1 km s−1. The depleted region at 3 pc in the NW direction is still there, but perhaps less pronounced than in CO(3–2) because of the larger beam of 0.019″. Taking into account that the beam size has an area 1.65 larger in the HCO+(4–3) map, the CO(3–2) maximum is still higher by a factor 1.1, but this ratio is surprisingly low with respect to the common ratios of ∼3–6 quoted above.
In NGC 1672, the concentration of dense molecular gas is less pronounced. While the maximum value of the CO(3–2) zeroth-moment map is 0.21 Jy beam−1 km s−1, the HCO+(4–3) maximum is only 0.072 Jy beam−1 km s−1, and given the beam ratios of 1.49, the CO(3–2) is stronger by a factor of 4.3.
To quantify the global emissions detected in the molecular torus and circumnuclear region of 50 pc in diameter, we plot in Fig. 13 the total spectrum in CO(3–2) and HCO+(4–3) for both galaxies. In Table 4, the results of the Gaussian fits for these total spectra are displayed. It can be seen that the global integrated signal ratio between CO(3–2) and HCO+(4–3) is 2.4 for NGC 613 and 8 for NGC 1672. It is therefore clear that the ratio increases with distance from center, as is expected, since the molecular gas is much denser near the core, and this effect is even exacerbated in NGC 613. Another comparison can be done with the larger scales sampled at low resolution (Audibert et al. 2019). In NGC 613, the CO(3–2) to HCO+(4–3) ratio is 40. It is the same order of magnitude in NGC 1672, with more uncertainty. Such ratios are common at kiloparsec scales in galaxies (e.g. Usero et al. 2015; Izumi et al. 2016).
Comparison of total integrated fluxes in the central 50 pc circumnuclear regions of both galaxies, in the CO(3–2) and HCO+(4–3) lines.
The three moments for the HCO+(4–3) line are quite similar to that of CO(3–2), when the lower sensitivity is taken into account, in particular far from the nuclei. The low signal-to-noise ratio is more severe for NGC 1672, where the molecular torus is quite noisy. However, the strong velocity gradient is clear, as is the warp of the torus to the NE. The low- and high-resolution velocity fields are compared in Figs. B.1 and B.2.
5. Discussion
5.1. NGC 613 model in view of the new morphology
From low-resolution maps, the molecular torus was identified as the nuclear disk of radius 14 pc, located inside the nuclear spiral, and kinematically decoupled from the galaxy disk. The high-resolution map has kept nearly the same morphology and orientation, but reduced the torus radius from 14 to 8 pc, and reduced its mass by more than a factor of 2, from 3.9 to 1.4 × 10⁷ M⊙, even taking into account the 10% missing flux. The torus is resolved in a lopsided ring. The inclination and orientation of the torus might still be different from those of the accretion disk and its surrounding inside the torus. The radio jet at centimeter wavelengths is oriented along the minor axis of the 300 pc-radius ring, unrelated to the torus. The velocity profile of the H2O maser detected close to the nucleus has a two-horn shape, with two narrow features, each located 40 km s−1 away from the systemic velocity (Castangia et al. 2008). This indicates a more face-on orientation.
5.2. NGC 1672 model in view of the new morphology
One of the striking features is the discovery at high resolution of the actual torus, which is edge-on and geometrically very thin. At low resolution it was embedded in another component, making the ensemble appear at a lower inclination of 68°, and with another position angle (90°). This structure surrounding the edge-on thin torus is a patchy ring extending from 0.3″ to 0.5″. Its radius of ∼22 pc may correspond to a dynamical feature. NGC 1672 is a barred galaxy, with a corotation at 4.6 kpc, and an ILR ring at radius 220 pc (Fazeli et al. 2020). The patchy ring could correspond to a secondary bar or spiral, which has now been identified in the JWST images (Williams et al. 2024).
The fact that the torus is very thin (axis ratio of 6.5, and up to 10 taking into account the warped extension) does not favor the classical model of thick dusty torus, as has already been questioned in several circumstances (e.g. Hönig 2019; Isbell et al. 2023). It is one of the first times when this geometrically thin character is clearly seen in any torus, except the H2O masers thin disks around 0.5 pc in radius in other galaxies (e.g. Herrnstein et al. 1999; Gallimore & Impellizzeri 2023).
The velocity field looked deformed and slanted at low resolution, because of the two components with different axes. In the model, mistaken by including only one component, with the wrong orientation, the predicted velocity dispersion was incorrect, and did not reproduce the observation. The solution is not given either by the models from Bannikova et al. (2021), who propose a geometrically thick torus, inclined at i = 60°; the torus is made of optically thick clumps, and absorption produces the effect that the torus hotter and inner radii are only seen at some inclinations, at the origin of the velocity dispersion. However, molecular clumps on a given line of sight do not overlap in velocity and absorb each other, due to the velocity gradient, and molecular disks are considered globally optically thin (Dickman et al. 1986).
5.3. Warping and misalignment
The molecular torus in NGC 1672 is clearly warped. Other tori might also be warped, but this is not easy to see because of their inclination. In NGC 613, the torus appears as an offset and lopsided molecular ring with two spirals joining at a position angle of PA = 45°. The spiral’s SE junction coincides with a peak of emission. The oval shape looks somewhat truncated at SE, which might be due to bending. While it is now well established that molecular tori are often kinematically decoupled (García-Burillo et al. 2016; Combes et al. 2019; Tristram et al. 2022), and have a dynamical state rather independent of their galaxy, they are still embedded in a potential well that is not yet completely spherical, as near the BH, but has a restoring force toward the disk. It is then likely that they precess, and also warp, on a dynamical timescale. They are still subject to their own self-gravity, since their masses are not negligible with respect to the supermassive black hole (SMBH).
It is possible to give an order of magnitude of the precessing rate as a function of the flattening of the potential. In a slightly oblate potential, the precession rate, ωp, of a mass, m, in rotation with an angular speed, Ω, at a radius, r, in a plane tilted by an angle, θ, with the symmetry axis of the potential can be written as (Sparke 1996)
 (2)
(2)
where V is the potential energy of the mass, m, averaged along its circular orbit. In a nearly spherical potential, with ellipticity η, assuming a nearly flat rotation curve, this can be approximated by
 (3)
(3)
The derived precession period, Tp = 2π/ωp, in such a slightly oblate potential is on the order of a few orbital periods, for θ < 40°. The lifetime of the warp will depend on the differential precession as a function of radius, which is decreasing with radius, unless cosθ ∝ r to cancel the differential rates. Warps could then be as long-lived as the torus themselves in their outer parts. The lifetime of the torus is limited by instabilities that accelerate gas accretion toward the SMBH (e.g. Barker & Ogilvie 2014).
Molecular tori are in the SoI of their central BHs, with a nearly Keplerian potential, but also with some contribution of their self-gravity. In this region, given some pressure forces, there is a range of radii where the specific angular momentum is nearly constant, and where we could expect non-axisymmetric instabilities (Papaloizou & Pringle 1984), in particular since the PPI (Papaloizou-Pringle instability) persists if the specific angular momentum is not uniform (Papaloizou & Pringle 1985). Numerical simulations have shown the development of lopsided m = 1 instabilities (Barker & Ogilvie 2016; Donmez 2017), in particular under some accretion perturbation (Dönmez 2014). In such conditions, where the instabilities can live several rotation periods, the gas is driven toward the center through the subsequent torques. The lifetime of such a torus is on the order of a few million years, and should be refilled through accretion from the rest of the disk.
Accretion is precisely one of the main mechanisms to produce misaligned nuclear disks. When gas clouds are driven inward from the thicker large-scale disk, they arrive with randomized angular momentum (Hopkins et al. 2012; Anglés-Alcázar et al. 2021). Also gas can be acquired from a fountain effect, after star formation feedback, raining back into the galaxy plane. Such phenomena have been found in N-body-hydro simulations, forming nuclear polar disks (e.g. Emsellem et al. 2015).
6. Conclusions
We have presented high-spatial-resolution maps from ALMA cycle 7 of the two Seyfert galaxies NGC 613 and NGC 1672. In Band 7, with the maximum baseline of 16 km, we have achieved a beam of 15 mas in robust weighting for the CO(3–2) line, and 19 mas in natural weighting for the HCO+(4–3). The resolution corresponds to 1.2 and 0.8 pc on the NGC 613 and NGC 1672 plane, respectively. This is well below the SoI of their SMBH. Comparing the derived morphology and kinematics with our previous low-resolution maps obtained with more compact configurations, we found several new features:
-
The molecular tori that were barely resolved are now smaller; in NGC 613, it has been decomposed in an actual torus, similar to a ring, with about the same inclination and position angle, but is now 8 pc in radius. It appears as a lopsided ring, with a hole at 3 pc from the center, and with two nascent spiral arms, joining the nuclear spiral structure. In NGC 1672, there are two components. The true molecular torus, still kinematically decoupled from the galaxy disk, is now edge-on with another position angle, and is strongly warped. It is embedded in a more face-on structure, with a different position angle.
-
The strong rotation around an axis completely different from the galaxy axis is confirmed in both galaxies. Given the high resolution, we get velocities well inside the sphere of influence of the BH, where the other mass components of the galaxies, essentially the bulge at parsec-scale distance from the center, provide a negligible contribution. Assuming circular orbits, it is possible to directly estimate a BH mass, MBH. The latter is perfectly consistent with previous estimates in both galaxies. The velocity gradients are now well resolved. With high resolution, it is now realized that the torus in NGC 1672 is smaller, with a different inclination.
-
While NGC 613 shows an [OIII] ionized gas outflow in the direction of the radio jet, at the kiloparsec scale, and we see a molecular outflow in the same direction at 25 pc-scale, we do not see the outflow at the parsec scale. Instead we see line wings extending the rotation, which is redshifted in a direction opposite to that of the jet.
-
The continuum emission in both galaxies is well resolved, and severely filtered out by the interferometer. In NGC 613, its elongated shape may indicate the start of the radio jet. The line emission is less filtered out, and we are only missing ∼10–40% of the flux.
-
The dense gas tracer HCO+(4–3) line is well detected, and shows a high central concentration. In the nucleus of NGC 613, the line is almost as strong as the CO(3–2) line. The CO(3–2)/HCO+(4–3) ratio decreases rapidly with decreasing radius, and reaches 2.4 globally in NGC 613 and 8 in the less concentrated nucleus NGC 1672. At low resolution, in the field of view including the 300 pc ring, the ratio climbs up to 40 in NGC 613.
-
The high resolution has enabled us to fully resolve molecular tori. One of them is edge-on, geometrically thin, and warped. This does not favor the classical geometrically thick tori model. The circumnuclear material, which can obscure the AGN, is not a thick dusty torus but a thin molecular torus. It is able to obscure the AGN if edge-on, aided by the polar dust when it is present, which may widen the obscuring area. The thin torus may be short-lived, by a few rotation periods, due to PPI instabilities, and the warp in its outer parts should have about the same lifetime due to differential precession in a nearly spherical potential. This short lifetime ensures an efficient fueling of the SMBH, as soon as the gas has accumulated in the torus, through gravity torques. It is a natural explanation for the variability of the AGN and perhaps the changing look of some objects (e.g. Ricci & Trakhtenbrot 2023). Further fueling of the nucleus could then be weakened or stopped due to feedback, waiting for the next secular evolution cycle.
These results show beautifully how much information ALMA and its high spatial resolution can provide to unveil the morphology and dynamics of the AGN circumnuclear regions. Warping and misalignment are clues as to the transient nature of these tori, which may last a few dynamical timescales. Mapping only at lower angular resolution may give us an incomplete impression of the molecular gas kinematics and distribution close to galaxy nuclei.
Acknowledgments
We sincerely thank the referee for very useful and constructive comments, and a thorough reading of the manuscript. The ALMA staff in Chile and ARC-people at IRAM are gratefully acknowledged for their help in the data reduction. SA gratefully acknowledges funding from the European Research Council (ERC) under the European Union’s Horizon 2020 research and innovation programme (grant agreement No. 789410). AA acknowledges support from the European Union (WIDERA ExGal-Twin, GA 101158446) and from the Agencia Estatal de Investigación of the Ministerio de Ciencia, Innovación y Universidades (MCIU/AEI) under the grant “Tracking active galactic nuclei feedback from parsec to kiloparsec scales”, with reference PID2022−141105NB−I00 and the European Regional Development Fund (ERDF). VC acknowledges funding from the INAF Mini Grant 2022 program “Face-to-Face with the Local Universe: ISM’s Empowerment (LOCAL). SGB acknowledges support from the Spanish grant PID2022-138560NB-I00, funded by MCIN/AEI/10.13039/501100011033/FEDER, EU. LKH acknowledges funding from the INAF PRIN-SKA 2017 program 1.05.01.88.04. SV acknowledges support from the European Research Council (ERC) under the European Union’s Horizon 2020 research and innovation programme MOPPEX 833460. This paper makes use of the following ALMA data: ADS/JAO.ALMA project 2019.0.00273.S (PI: F. Combes). ALMA is a partnership of ESO (representing its member states), NSF (USA), and NINS (Japan), together with NRC (Canada) and NSC and ASIAA (Taiwan), in cooperation with the Republic of Chile. The Joint ALMA Observatory is operated by ESO, AUI/NRAO, and NAOJ. The National Radio Astronomy Observatory is a facility of the National Science Foundation operated under cooperative agreement by Associated Universities, Inc. We used observations made with the NASA/ESA Hubble Space Telescope, and obtained from the Hubble Legacy Archive, which is a collaboration between the Space Telescope Science Institute (STScI/NASA), the Space Telescope European Coordinating Facility (ST-ECF/ESA), and the Canadian Astronomy Data center (CADC/NRC/CSA). This work was supported by the Programme National Cosmology et Galaxies (PNCG) of CNRS/INSU with INP and IN2P3, co- funded by CEA and CNES. The data were processed using the Gildas package. We made use of the NASA/IPAC Extragalactic Database (NED), and of the HyperLeda database (http://leda.univ-lyon1.fr).
References
- Alonso-Herrero, A., García-Burillo, S., Pereira-Santaella, M., et al. 2019, A&A, 628, A65 [NASA ADS] [CrossRef] [EDP Sciences] [Google Scholar]
- Alonso Herrero, A., García-Burillo, S., Pereira-Santaella, M., et al. 2023, A&A, 675, A88 [NASA ADS] [CrossRef] [EDP Sciences] [Google Scholar]
- Anglés-Alcázar, D., Quataert, E., Hopkins, P. F., et al. 2021, ApJ, 917, 53 [CrossRef] [Google Scholar]
- Antonucci, R. R. J., & Miller, J. S. 1985, ApJ, 297, 621 [NASA ADS] [CrossRef] [Google Scholar]
- Asmus, D. 2019, MNRAS, 489, 2177 [NASA ADS] [CrossRef] [Google Scholar]
- Asmus, D., Hönig, S. F., & Gandhi, P. 2016, ApJ, 822, 109 [NASA ADS] [CrossRef] [Google Scholar]
- Audibert, A., Combes, F., García-Burillo, S., et al. 2019, A&A, 632, A33 [NASA ADS] [CrossRef] [EDP Sciences] [Google Scholar]
- Audibert, A., Combes, F., García-Burillo, S., et al. 2021, A&A, 656, A60 [NASA ADS] [CrossRef] [EDP Sciences] [Google Scholar]
- Bannikova, E. Y., Sergeyev, A. V., Akerman, N. A., et al. 2021, MNRAS, 503, 1459 [Google Scholar]
- Barker, A. J., & Ogilvie, G. I. 2014, MNRAS, 445, 2637 [NASA ADS] [CrossRef] [Google Scholar]
- Barker, A. J., & Ogilvie, G. I. 2016, MNRAS, 458, 3739 [Google Scholar]
- Bolatto, A. D., Wolfire, M., & Leroy, A. K. 2013, ARA&A, 51, 207 [CrossRef] [Google Scholar]
- Casasola, V., Hunt, L. K., Combes, F., García-Burillo, S., & Neri, R. 2011, A&A, 527, A92 [NASA ADS] [CrossRef] [EDP Sciences] [Google Scholar]
- Castangia, P., Tarchi, A., Henkel, C., & Menten, K. M. 2008, A&A, 479, 111 [NASA ADS] [CrossRef] [EDP Sciences] [Google Scholar]
- Castangia, P., Panessa, F., Henkel, C., Kadler, M., & Tarchi, A. 2013, MNRAS, 436, 3388 [NASA ADS] [CrossRef] [Google Scholar]
- Cicone, C., Maiolino, R., Sturm, E., et al. 2014, A&A, 562, A21 [NASA ADS] [CrossRef] [EDP Sciences] [Google Scholar]
- Combes, F. 2012, J. Phys. Conf. Ser., 372, 012041 [Google Scholar]
- Combes, F., García-Burillo, S., Casasola, V., et al. 2013, A&A, 558, A124 [NASA ADS] [CrossRef] [EDP Sciences] [Google Scholar]
- Combes, F., García-Burillo, S., Casasola, V., et al. 2014, A&A, 565, A97 [NASA ADS] [CrossRef] [EDP Sciences] [Google Scholar]
- Combes, F., García-Burillo, S., Audibert, A., et al. 2019, A&A, 623, A79 [NASA ADS] [CrossRef] [EDP Sciences] [Google Scholar]
- de Naray, P. J., Brandt, W. N., Halpern, J. P., & Iwasawa, K. 2000, AJ, 119, 612 [Google Scholar]
- Díaz, R., Carranza, G., Dottori, H., & Goldes, G. 1999, ApJ, 512, 623 [Google Scholar]
- Dickman, R. L., Snell, R. L., & Schloerb, F. P. 1986, ApJ, 309, 326 [NASA ADS] [CrossRef] [Google Scholar]
- Dönmez, O. 2014, MNRAS, 438, 846 [Google Scholar]
- Donmez, O. 2017, Mod. Phys. Lett. A, 32, 1750108 [Google Scholar]
- Dubois, Y., Gavazzi, R., Peirani, S., & Silk, J. 2013, MNRAS, 433, 3297 [CrossRef] [Google Scholar]
- Emsellem, E., Renaud, F., Bournaud, F., et al. 2015, MNRAS, 446, 2468 [Google Scholar]
- Esposito, F., Alonso-Herrero, A., García-Burillo, S., et al. 2024, A&A, 686, A46 [NASA ADS] [CrossRef] [EDP Sciences] [Google Scholar]
- Fazeli, N., Eckart, A., Busch, G., et al. 2020, A&A, 638, A36 [NASA ADS] [CrossRef] [EDP Sciences] [Google Scholar]
- Fiore, F., Feruglio, C., Shankar, F., et al. 2017, A&A, 601, A143 [NASA ADS] [CrossRef] [EDP Sciences] [Google Scholar]
- Fluetsch, A., Maiolino, R., Carniani, S., et al. 2019, MNRAS, 483, 4586 [NASA ADS] [Google Scholar]
- Gabor, J. M., & Bournaud, F. 2014, MNRAS, 441, 1615 [CrossRef] [Google Scholar]
- Gallimore, J. F., & Impellizzeri, C. M. V. 2023, ApJ, 951, 109 [NASA ADS] [CrossRef] [Google Scholar]
- Gámez Rosas, V., van der Werf, P., Gallimore, J. F., et al. 2025, A&A, 699, A187 [NASA ADS] [CrossRef] [EDP Sciences] [Google Scholar]
- García-Bernete, I., Alonso-Herrero, A., García-Burillo, S., et al. 2021, A&A, 645, A21 [EDP Sciences] [Google Scholar]
- García-Burillo, S., Combes, F., Hunt, L. K., et al. 2003, A&A, 407, 485 [NASA ADS] [CrossRef] [EDP Sciences] [Google Scholar]
- García-Burillo, S., Combes, F., Schinnerer, E., Boone, F., & Hunt, L. K. 2005, A&A, 441, 1011 [NASA ADS] [CrossRef] [EDP Sciences] [Google Scholar]
- García-Burillo, S., Combes, F., Usero, A., et al. 2014, A&A, 567, A125 [Google Scholar]
- García-Burillo, S., Combes, F., Ramos Almeida, C., et al. 2016, ApJ, 823, L12 [Google Scholar]
- García-Burillo, S., Combes, F., Ramos Almeida, C., et al. 2019, A&A, 632, A61 [Google Scholar]
- García-Burillo, S., Alonso-Herrero, A., Ramos Almeida, C., et al. 2021, A&A, 652, A98 [NASA ADS] [CrossRef] [Google Scholar]
- García-Burillo, S., Hicks, E. K. S., Alonso-Herrero, A., et al. 2024, A&A, 689, A347 [NASA ADS] [CrossRef] [EDP Sciences] [Google Scholar]
- Goesaert, W. M., Tristram, K. R. W., Impellizzeri, C. M. V., et al. 2025, arXiv e-prints [arXiv:2510.05199] [Google Scholar]
- Gorski, M. D., Aalto, S., König, S., et al. 2024, A&A, 684, L11 [NASA ADS] [CrossRef] [EDP Sciences] [Google Scholar]
- Gratadour, D., Rouan, D., Grosset, L., Boccaletti, A., & Clénet, Y. 2015, A&A, 581, L8 [NASA ADS] [CrossRef] [EDP Sciences] [Google Scholar]
- GRAVITY Collaboration (Pfuhl, O., et al.) 2020, A&A, 634, A1 [NASA ADS] [CrossRef] [EDP Sciences] [Google Scholar]
- Greve, T. R., Papadopoulos, P. P., Gao, Y., & Radford, S. J. E. 2009, ApJ, 692, 1432 [Google Scholar]
- Guilloteau, S., & Lucas, R. 2000, in Imaging at Radio through Submillimeter Wavelengths, eds. J. G. Mangum, & S. J. E. Radford, ASP Conf. Ser., 217, 299 [Google Scholar]
- Haidar, H., Rosario, D. J., Alonso-Herrero, A., et al. 2024, MNRAS, 532, 4645 [Google Scholar]
- Herrnstein, J. R., Moran, J. M., Greenhill, L. J., et al. 1999, Nature, 400, 539 [NASA ADS] [CrossRef] [Google Scholar]
- Hönig, S. F. 2019, ApJ, 884, 171 [Google Scholar]
- Hönig, S. F., & Kishimoto, M. 2010, A&A, 523, A27 [NASA ADS] [CrossRef] [EDP Sciences] [Google Scholar]
- Hopkins, P. F., Grudic, M. Y., Su, K.-Y., et al. 2024, Open J. Astrophys., 7, 18 [NASA ADS] [Google Scholar]
- Hopkins, P. F., & Quataert, E. 2010, MNRAS, 407, 1529 [Google Scholar]
- Hopkins, P. F., Hernquist, L., Hayward, C. C., & Narayanan, D. 2012, MNRAS, 425, 1121 [NASA ADS] [CrossRef] [Google Scholar]
- Hummel, E., & Jorsater, S. 1992, A&A, 261, 85 [NASA ADS] [Google Scholar]
- Hummel, E., Jorsater, S., Lindblad, P. O., & Sandqvist, A. 1987, A&A, 172, 51 [NASA ADS] [Google Scholar]
- Imanishi, M., Nakanishi, K., & Izumi, T. 2016, ApJ, 822, L10 [Google Scholar]
- Imanishi, M., Nguyen, D. D., Wada, K., et al. 2020, ApJ, 902, 99 [CrossRef] [Google Scholar]
- Impellizzeri, C. M. V., Gallimore, J. F., Baum, S. A., et al. 2019, ApJ, 884, L28 [NASA ADS] [CrossRef] [Google Scholar]
- Isbell, J. W., Pott, J. U., Meisenheimer, K., et al. 2023, A&A, 678, A136 [NASA ADS] [CrossRef] [EDP Sciences] [Google Scholar]
- Izumi, T., Kawakatu, N., & Kohno, K. 2016, ApJ, 827, 81 [NASA ADS] [CrossRef] [Google Scholar]
- Jenkins, L. P., Brandt, W. N., Colbert, E. J. M., et al. 2011, ApJ, 734, 33 [NASA ADS] [CrossRef] [Google Scholar]
- Jungwiert, B., Combes, F., & Axon, D. J. 1997, A&AS, 125, 479 [NASA ADS] [CrossRef] [EDP Sciences] [Google Scholar]
- Kameno, S., Sawada-Satoh, S., Impellizzeri, C. M. V., et al. 2020, ApJ, 895, 73 [CrossRef] [Google Scholar]
- Kewley, L. J., Heisler, C. A., Dopita, M. A., et al. 2000, ApJ, 530, 704 [Google Scholar]
- Kondratko, P. T., Greenhill, L. J., Moran, J. M., et al. 2006, ApJ, 638, 100 [Google Scholar]
- Koudmani, S., Sijacki, D., & Smith, M. C. 2022, MNRAS, 516, 2112 [NASA ADS] [CrossRef] [Google Scholar]
- Leftley, J. H., Hönig, S. F., Asmus, D., et al. 2019, ApJ, 886, 55 [NASA ADS] [CrossRef] [Google Scholar]
- Lutz, D., Sturm, E., Janssen, A., et al. 2020, A&A, 633, A134 [NASA ADS] [CrossRef] [EDP Sciences] [Google Scholar]
- Mahieu, S., Maier, D., Lazareff, B., et al. 2012, IEEE Trans. Terahertz Sci. Technol., 2, 29 [Google Scholar]
- Malkan, M. A., Gorjian, V., & Tam, R. 1998, ApJS, 117, 25 [Google Scholar]
- McMullin, J. P., Waters, B., Schiebel, D., Young, W., & Golap, K. 2007, in Astronomical Data Analysis Software and Systems XVI, eds. R. A. Shaw, F. Hill, & D. J. Bell, ASP Conf. Ser., 376, 127 [Google Scholar]
- Merritt, D. 2004, Coevolution of Black Holes and Galaxies, 263 [Google Scholar]
- Miyamoto, Y., Nakai, N., Seta, M., et al. 2017, PASJ, 69, 83 [CrossRef] [Google Scholar]
- Nenkova, M., Sirocky, M. M., Nikutta, R., Ivezić, Ž., & Elitzur, M. 2008, ApJ, 685, 160 [Google Scholar]
- Papaloizou, J. C. B., & Pringle, J. E. 1984, MNRAS, 208, 721 [NASA ADS] [CrossRef] [Google Scholar]
- Papaloizou, J. C. B., & Pringle, J. E. 1985, MNRAS, 213, 799 [NASA ADS] [Google Scholar]
- Ramos Almeida, C., & Ricci, C. 2017, Nat. Astron., 1, 679 [Google Scholar]
- Ricci, C., & Trakhtenbrot, B. 2023, Nat. Astron., 7, 1282 [Google Scholar]
- Silva-Lima, L. A., Gadotti, D. A., Martins, L. P., et al. 2025, MNRAS, 540, 2787 [Google Scholar]
- Sparke, L. S. 1996, ApJ, 473, 810 [NASA ADS] [CrossRef] [Google Scholar]
- Steer, I., Madore, B. F., Mazzarella, J. M., et al. 2017, AJ, 153, 37 [Google Scholar]
- Tacconi, L. J., Genzel, R., Saintonge, A., et al. 2018, ApJ, 853, 179 [Google Scholar]
- Tristram, K. R. W., Impellizzeri, C. M. V., Zhang, Z.-Y., et al. 2022, A&A, 664, A142 [NASA ADS] [CrossRef] [EDP Sciences] [Google Scholar]
- Urry, C. M., & Padovani, P. 1995, PASP, 107, 803 [NASA ADS] [CrossRef] [Google Scholar]
- Usero, A., Leroy, A. K., Walter, F., et al. 2015, AJ, 150, 115 [Google Scholar]
- Uzuo, T., Wada, K., Izumi, T., et al. 2021, ApJ, 915, 89 [NASA ADS] [CrossRef] [Google Scholar]
- Ward, S. R., Harrison, C. M., Costa, T., & Mainieri, V. 2022, MNRAS, 514, 2936 [NASA ADS] [CrossRef] [Google Scholar]
- Williams, T. G., Lee, J. C., Larson, K. L., et al. 2024, ApJS, 273, 13 [NASA ADS] [CrossRef] [Google Scholar]
Appendix A: CO(3–2) channel maps for NGC 1672
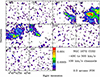 |
Fig. A.1. Channel map in CO(3–2) of NGC 1672. Each channel is 100 km s−1 wide, and are plotted to the same flux scale, in Jy beam−1, averaged over the channel velocity range. Each panel is 0.3″ in size. |
Appendix B: Comparison between low- and high-resolution velocity maps for HCO+(4–3)
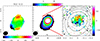 |
Fig. B.1. Low resolution at ∼ 0.19″ of the velocity field (left), and the density (middle) of the HCO+(4–3) line in NGC 613, compared with the high resolution at ∼ 0.015” (right) of the velocity field. In the right panel, the contours of the low resolution HCO+(4–3) map are superposed. The color scale is in velocity difference from the Vsys= 1481 km s−1. The spatial scales of all panels are RA-Dec in arc seconds, from the center of Table 1. |
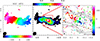 |
Fig. B.2. Same as Fig B.1 but for NGC 1672. The color scale is in velocity difference from the Vsys= 1331 km s−1. |
All Tables
Comparison of total integrated fluxes in the central 50 pc circumnuclear regions of both galaxies, in the CO(3–2) and HCO+(4–3) lines.
All Figures
|
Fig. 1. Continuum map at 0.86 mm of the NGC 613 (left) and NGC 1672 (right) nucleus. The spatial scale is RA-Dec offset in arcsec from the central position of Table 1. The color scale is in milliJansky beam−1. The first contour is at 2σ, and the next contours are spaced by 1σ (see Sect. 4.1 for the value of σ). The AGN center is indicated by a black cross, and the bar at bottom left is 1 pc long. A red arrow indicates the jet direction in NGC 613. |
| In the text | |
|
Fig. 2. Low resolution (but without the most compact configurations) at ∼0.1″ (left), zoomed in on the middle and high resolution at ∼0.015″ (right) of the CO(3–2) surface density toward NGC 613. The left and middle moment-0 maps have been integrated over a velocity range −175 to 175 km s−1, and with a threshold of 2.3 mJy beam−1. In the right panel, the CO(3–2) contours of the low-resolution map are overlaid. While the left panel is plotted in absolute coordinates, the spatial scales of the two others are RA-Dec offsets in arc seconds, from the center of Table 1. The color scale is in Jy beam−1 km s−1. |
| In the text | |
|
Fig. 3. Same as Fig. 2 but for NGC 1672, with a different color bar. The left and middle moment-0 maps have been integrated over a velocity range from −200 to 200 km s−1, and with a threshold of 4 mJy beam−1. The color scale is in Jy beam−1 km s−1. |
| In the text | |
|
Fig. 4. Comparison of the total spectrum within a circle of 0.2″ in diameter between the high-resolution CO(3–2) observation of NGC 613 (left, bottom) and low resolution (left, top). Same for NGC 1672 at right. The vertical scale is the flux in Jansky. The involved aperture is much larger than the torus here. |
| In the text | |
|
Fig. 5. Cartoons to identify the principal components in NGC 613 (left) and NGC 1672 (right). For NGC 613, there is an H2O maser detected in the (0,0) nucleus position (Kondratko et al. 2006; Castangia et al. 2008). The scales are RA-Dec offsets in arc seconds. The AGN centers are indicated by faint crosshairs. |
| In the text | |
|
Fig. 6. Moment zero (left), one (middle), and two (right) of the CO(3–2) cube with 0.015″ beam toward NGC 613. An H2O maser has been detected coinciding with the (0,0) position (Kondratko et al. 2006; Castangia et al. 2008). The color scale to the left is in Jy beam−1 km s−1. The moments have been integrated over a velocity range from −300 to 300 km s−1, and with a threshold of 0.6 mJy beam−1. In the middle, the color scale is in velocity difference from the Vsys = 1481 km s−1. On the right the color scale is given in km s−1. The synthesized beam is shown in the bottom left corner of right box. The spatial scales are RA-Dec in arc seconds, from the central position reported in Table 1. |
| In the text | |
|
Fig. 7. Same as Fig. 6 but for NGC 1672. The moments have been integrated over a velocity range from −250 to 250 km s−1, and with a threshold of 0.55 mJy beam−1. In the middle, the color scale is in velocity difference from the Vsys = 1331 km s−1. |
| In the text | |
|
Fig. 8. CO(3–2) average spectrum from the high-resolution configuration of the 0.014″ central beam of NGC 613, showing high-velocity components (left), and of NGC 1672 (right). The vertical scale is Flux in milliJansky. |
| In the text | |
|
Fig. 9. Channel map in CO(3–2) of NGC 613. Each channel is 100 km s−1 wide, to show the high-velocity component with the same flux scale. The latter is in Jy beam−1, average over the channel velocity range. Each panel is 0.2″ in size. |
| In the text | |
|
Fig. 10. Velocity map of the NGC 613 CO(3–2) line residuals, once the spectra have been fit by a Gaussian, inside the range −150 to 150 km s−1, first at low resolution (left) and then at high resolution (right). Note that the field of view is different in the two panels (1″, and 0.1″, respectively). The contours of the CO(3–2) map at low resolution are overlaid in the left panel. The scale is RA-Dec offset in ″. The color scale is in km s−1. |
| In the text | |
|
Fig. 11. Position–velocity diagram in CO(3–2) for NGC 1672, taken along the major axis of the torus, PA = 70°. The two panels are the same, with at right the superposition in blue of the circular velocity of the galaxy model with MBH = 4.5 × 10⁷ M⊙. The red contours are from the gas density of the torus model. The strip of length 2″ is centered on the galaxy at 1″. The color bar scale is Jansky beam−1. |
| In the text | |
|
Fig. 12. Position–velocity diagram in CO(3–2) for NGC 613, taken along the major axis of the torus, PA = −20°. The circular velocity predicted in projection for MBH = 3.4 × 10⁷ M⊙ is superposed in red. The strip of length 0.3″ is centered on the galaxy at 0.15″. The color bar scale is Jansky beam−1. |
| In the text | |
|
Fig. 13. Total spectra in the high-resolution configuration, integrated over the field of view containing emission, 0.6″ for NGC 613 (left) and 1.7″ for NGC 1672 (right), in CO(3–2) (top), and HCO+(4–3) (bottom). The vertical scale is the flux in Jansky. |
| In the text | |
|
Fig. 14. Moment zero (left), one (middle), and two (right) of the HCO(4–3) cube with 0.019″ beam toward NGC 613. The moments have been integrated over a velocity range from −260 to 260 km s−1, and with a threshold of 2.2 mJy beam−1. In the middle, the color scale is in velocity difference from the Vsys = 1481 km s−1. The synthesized beam is shown in the bottom left corner of right box. The spatial scales are RA-Dec in arc seconds, from the central position reported in Table 1. |
| In the text | |
|
Fig. 15. Same as Fig. 14 but for NGC 1672. The moments have been integrated over a velocity range −260 to 260 km s−1, and with a threshold of 0.65 mJy beam−1. In the middle, the color scale is in velocity difference from the Vsys = 1331 km s−1. |
| In the text | |
|
Fig. A.1. Channel map in CO(3–2) of NGC 1672. Each channel is 100 km s−1 wide, and are plotted to the same flux scale, in Jy beam−1, averaged over the channel velocity range. Each panel is 0.3″ in size. |
| In the text | |
|
Fig. B.1. Low resolution at ∼ 0.19″ of the velocity field (left), and the density (middle) of the HCO+(4–3) line in NGC 613, compared with the high resolution at ∼ 0.015” (right) of the velocity field. In the right panel, the contours of the low resolution HCO+(4–3) map are superposed. The color scale is in velocity difference from the Vsys= 1481 km s−1. The spatial scales of all panels are RA-Dec in arc seconds, from the center of Table 1. |
| In the text | |
|
Fig. B.2. Same as Fig B.1 but for NGC 1672. The color scale is in velocity difference from the Vsys= 1331 km s−1. |
| In the text | |
Current usage metrics show cumulative count of Article Views (full-text article views including HTML views, PDF and ePub downloads, according to the available data) and Abstracts Views on Vision4Press platform.
Data correspond to usage on the plateform after 2015. The current usage metrics is available 48-96 hours after online publication and is updated daily on week days.
Initial download of the metrics may take a while.