Fig. 11.
Download original image
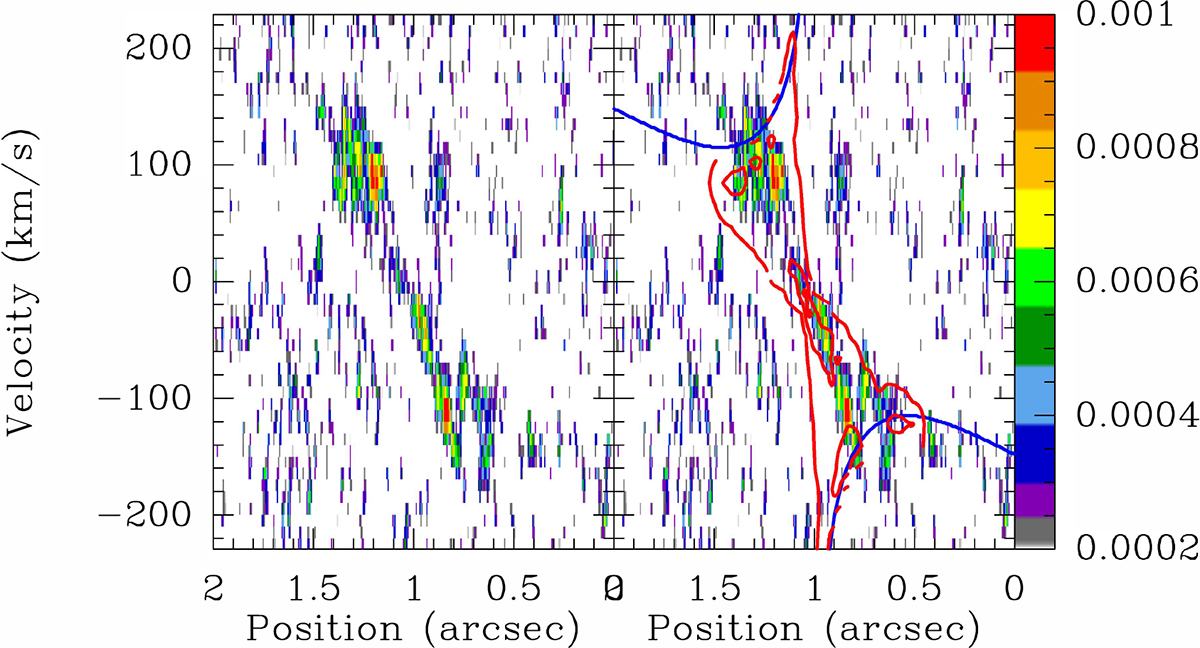
Position–velocity diagram in CO(3–2) for NGC 1672, taken along the major axis of the torus, PA = 70°. The two panels are the same, with at right the superposition in blue of the circular velocity of the galaxy model with MBH = 4.5 × 10⁷ M⊙. The red contours are from the gas density of the torus model. The strip of length 2″ is centered on the galaxy at 1″. The color bar scale is Jansky beam−1.
Current usage metrics show cumulative count of Article Views (full-text article views including HTML views, PDF and ePub downloads, according to the available data) and Abstracts Views on Vision4Press platform.
Data correspond to usage on the plateform after 2015. The current usage metrics is available 48-96 hours after online publication and is updated daily on week days.
Initial download of the metrics may take a while.