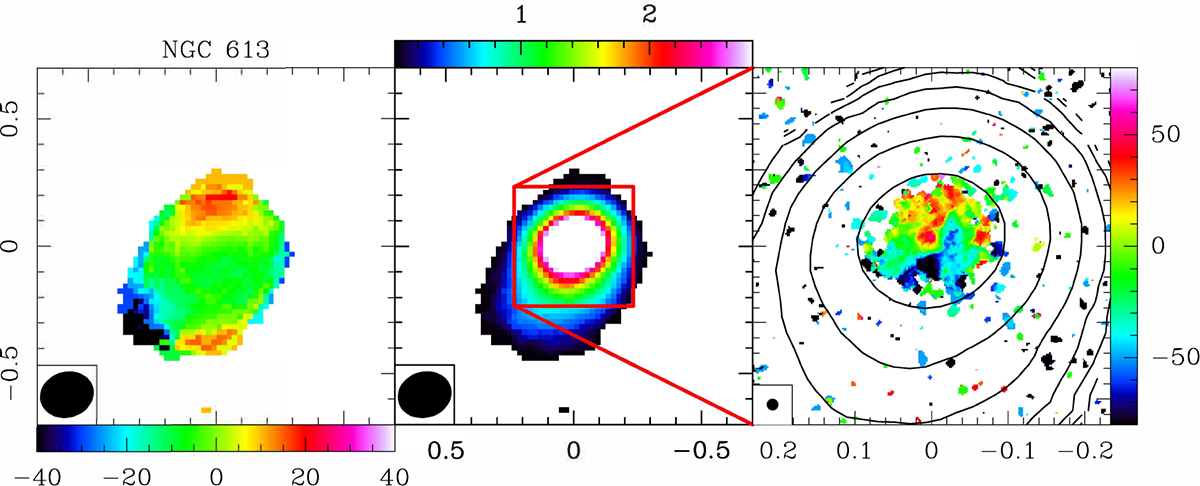
Fig. B.1.
Download original image
Low resolution at ∼ 0.19″ of the velocity field (left), and the density (middle) of the HCO+(4–3) line in NGC 613, compared with the high resolution at ∼ 0.015” (right) of the velocity field. In the right panel, the contours of the low resolution HCO+(4–3) map are superposed. The color scale is in velocity difference from the Vsys= 1481 km s−1. The spatial scales of all panels are RA-Dec in arc seconds, from the center of Table 1.
Current usage metrics show cumulative count of Article Views (full-text article views including HTML views, PDF and ePub downloads, according to the available data) and Abstracts Views on Vision4Press platform.
Data correspond to usage on the plateform after 2015. The current usage metrics is available 48-96 hours after online publication and is updated daily on week days.
Initial download of the metrics may take a while.