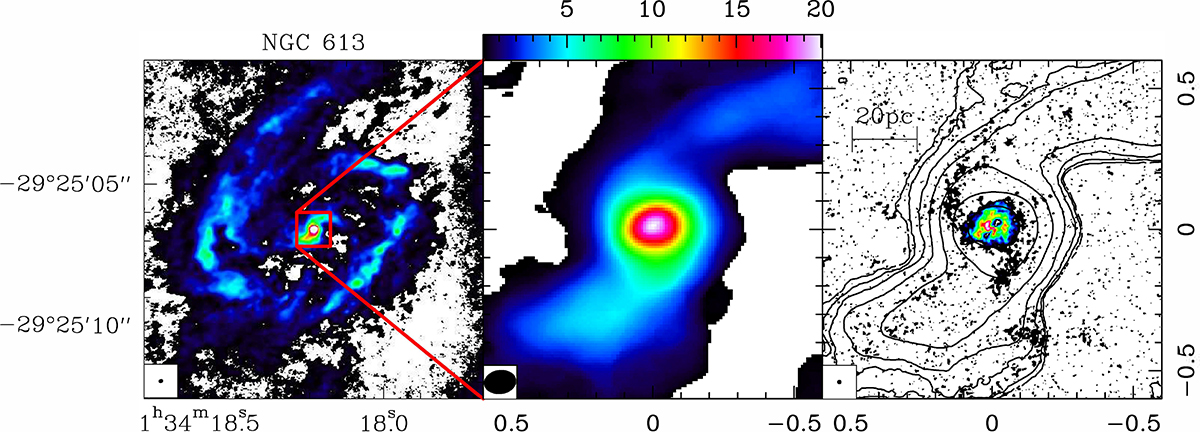
Fig. 2.
Download original image
Low resolution (but without the most compact configurations) at ∼0.1″ (left), zoomed in on the middle and high resolution at ∼0.015″ (right) of the CO(3–2) surface density toward NGC 613. The left and middle moment-0 maps have been integrated over a velocity range −175 to 175 km s−1, and with a threshold of 2.3 mJy beam−1. In the right panel, the CO(3–2) contours of the low-resolution map are overlaid. While the left panel is plotted in absolute coordinates, the spatial scales of the two others are RA-Dec offsets in arc seconds, from the center of Table 1. The color scale is in Jy beam−1 km s−1.
Current usage metrics show cumulative count of Article Views (full-text article views including HTML views, PDF and ePub downloads, according to the available data) and Abstracts Views on Vision4Press platform.
Data correspond to usage on the plateform after 2015. The current usage metrics is available 48-96 hours after online publication and is updated daily on week days.
Initial download of the metrics may take a while.