Open Access
Fig. 2.
Download original image
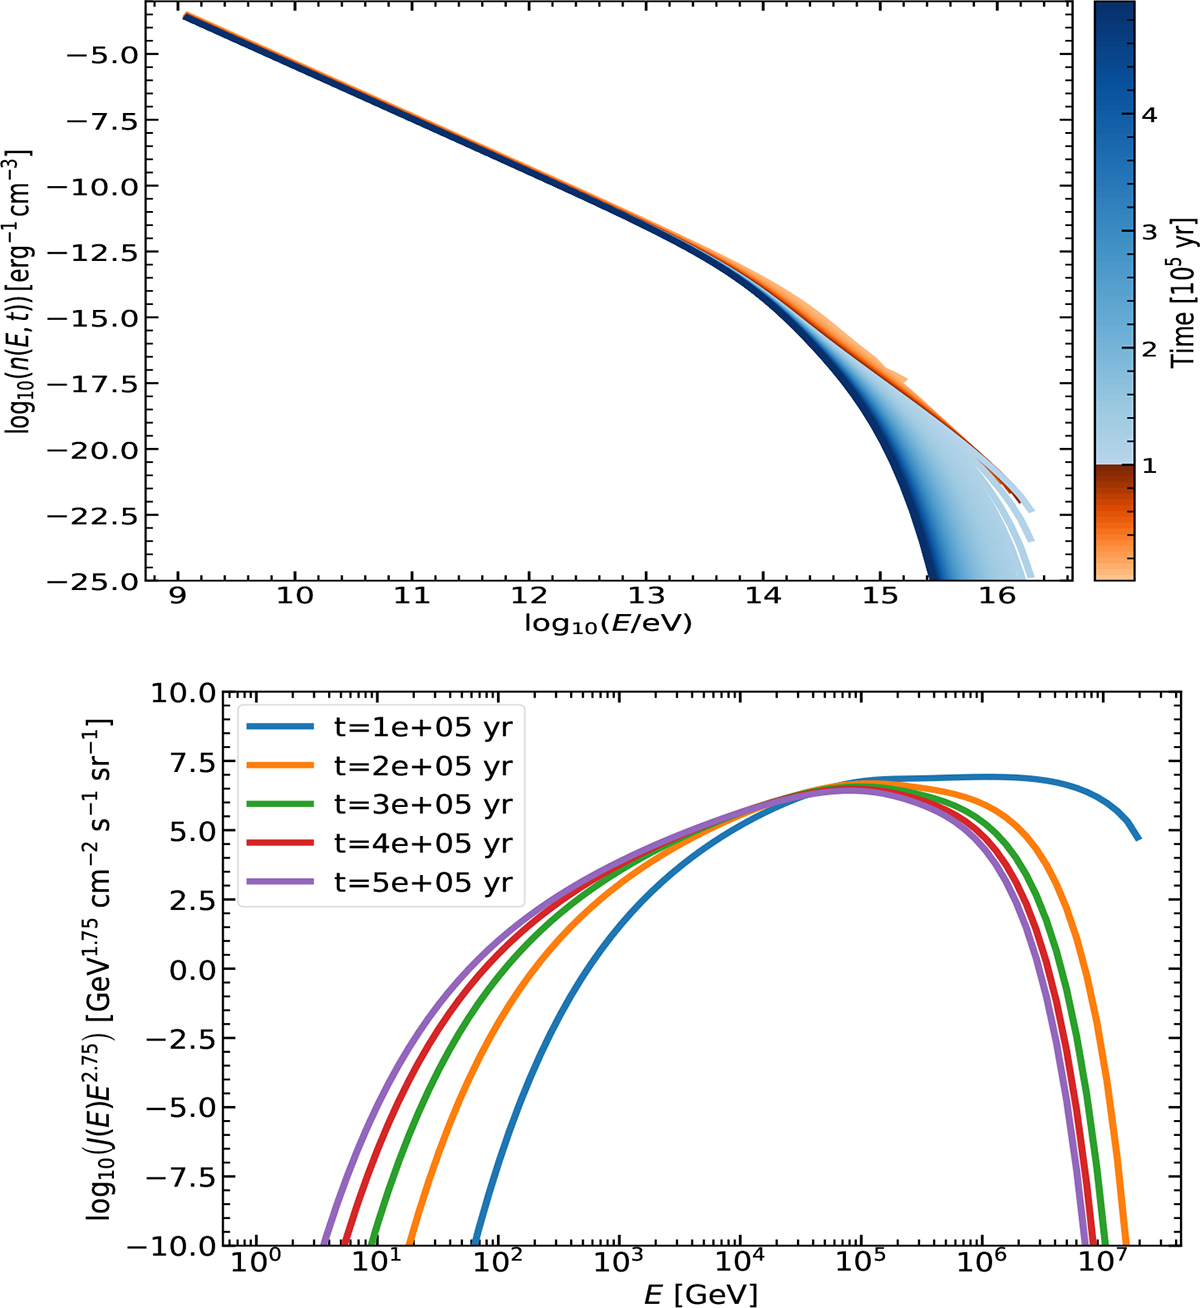
Evolution of proton distributions. Top: Cosmic rays within the cocoon. The color bar distinguishes the MQ (t < t0, orange) and MQR (t > t0, blue) phases. Bottom: Cosmic ray propagation to a distance of 100 pc from the MQR over time for a source with a continuous injection of particles.
Current usage metrics show cumulative count of Article Views (full-text article views including HTML views, PDF and ePub downloads, according to the available data) and Abstracts Views on Vision4Press platform.
Data correspond to usage on the plateform after 2015. The current usage metrics is available 48-96 hours after online publication and is updated daily on week days.
Initial download of the metrics may take a while.