Open Access
Fig. 2.
Download original image
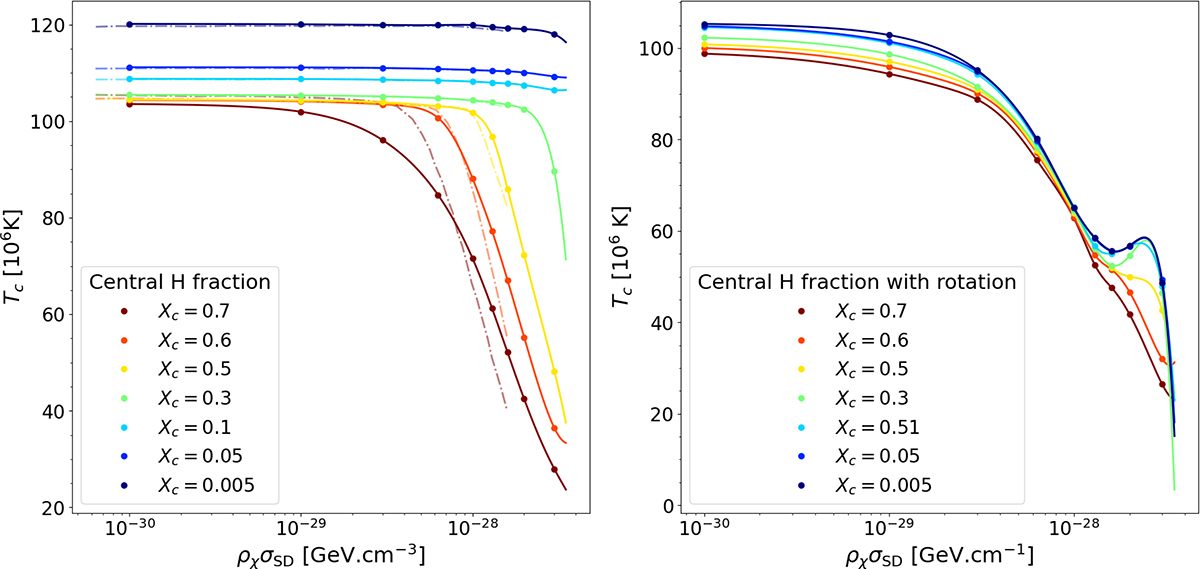
Central temperature as a function of WIMP density for a 20 M⊙ Pop III star without rotation (left) and with a rotation 20% of vcrit (right). Curves corresponding to different evolutionary stages (defined by the central hydrogen abundance) are plotted with spline interpolation; the dashed curves are taken from T08.
Current usage metrics show cumulative count of Article Views (full-text article views including HTML views, PDF and ePub downloads, according to the available data) and Abstracts Views on Vision4Press platform.
Data correspond to usage on the plateform after 2015. The current usage metrics is available 48-96 hours after online publication and is updated daily on week days.
Initial download of the metrics may take a while.