Fig. 1.
Download original image
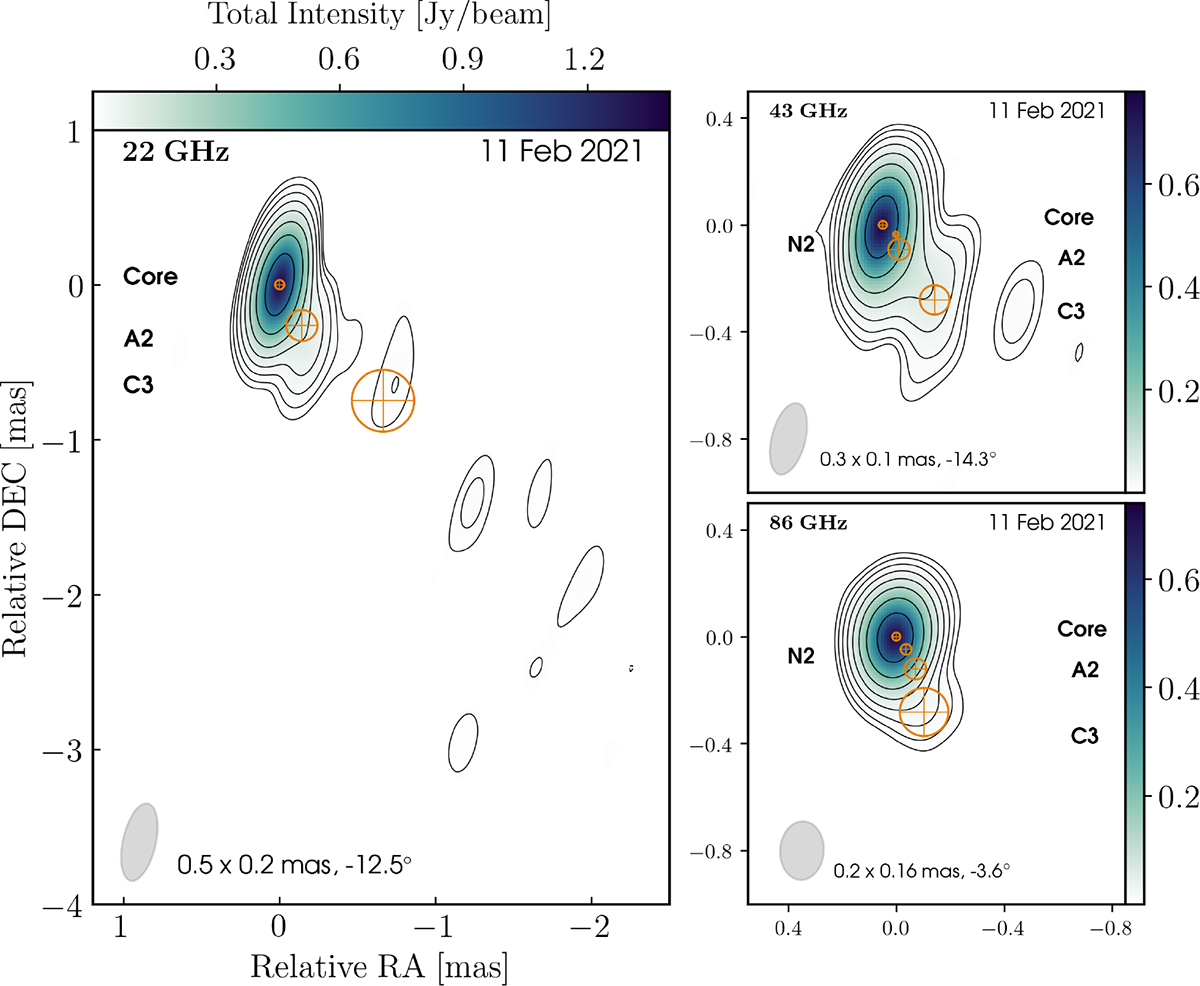
Total intensity images of TXS 2013+370 from 11 February 2021. Left: Observations at 22 GHz. Top-right: Observations at 43 GHz. Bottom-right: Observations at 86 GHz. Contours are at 0.5, 1, 2, 4, 8, 16, 32, and 64% of each panel’s peak (22: 1.33 Jy/beam; 43: 0.75 Jy/beam; 86: 0.71 Jy/beam). Restoring beams are shown as gray ellipses (parameters in Table 1). Orange circles mark MODELFIT Gaussian centroids. The 43 GHz map resolves a new knot (N2) near the core. At 86 GHz, the compact core and components (A2, C3, and N2) are clearly detected.
Current usage metrics show cumulative count of Article Views (full-text article views including HTML views, PDF and ePub downloads, according to the available data) and Abstracts Views on Vision4Press platform.
Data correspond to usage on the plateform after 2015. The current usage metrics is available 48-96 hours after online publication and is updated daily on week days.
Initial download of the metrics may take a while.