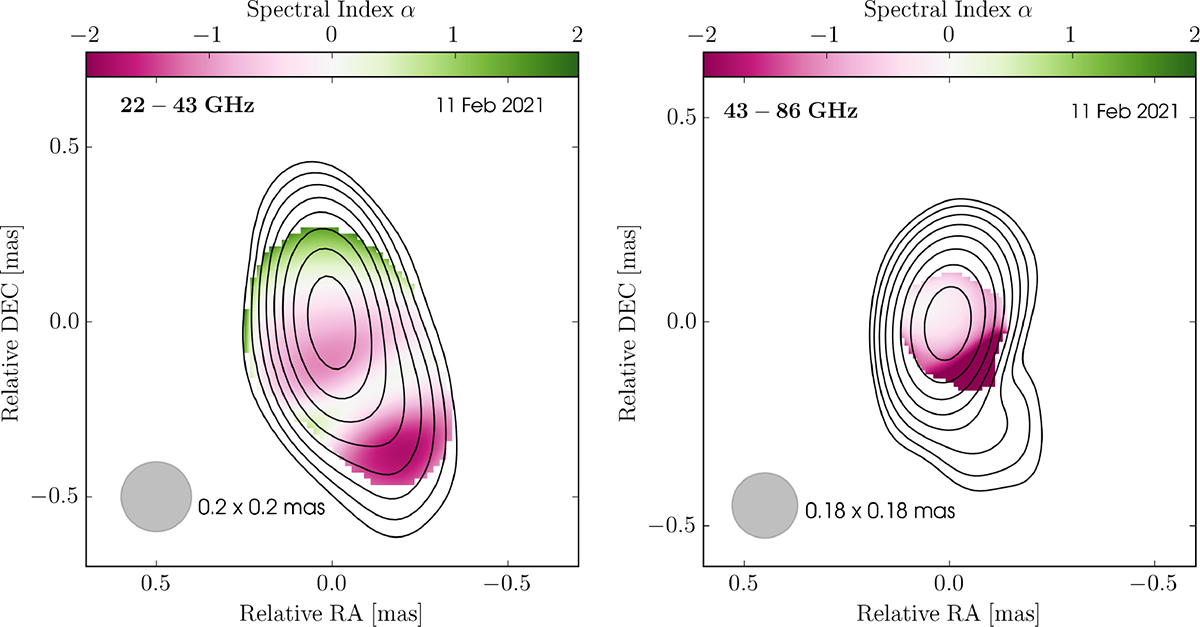
Fig. 3.
Download original image
Spectral index distributions of TXS 2013+370. The contour levels are set to 0.5, 1, 2, 4, 8, 16, 32, and 64% Jy/beam of the peak flux density of the highest frequency map in the pair (see Table 1) and represent the total intensity contours. All the images are convolved with a common beam that was set equal to the equivalent circular beam b = (bmaxbmin)1/2 of the highest frequency, and each frequency pair was aligned using a 2D cross-correlation analysis. Left: Frequency pair of 22-43 GHz. Right: Frequency pair of 43–86 GHz.
Current usage metrics show cumulative count of Article Views (full-text article views including HTML views, PDF and ePub downloads, according to the available data) and Abstracts Views on Vision4Press platform.
Data correspond to usage on the plateform after 2015. The current usage metrics is available 48-96 hours after online publication and is updated daily on week days.
Initial download of the metrics may take a while.