Fig. 4.
Download original image
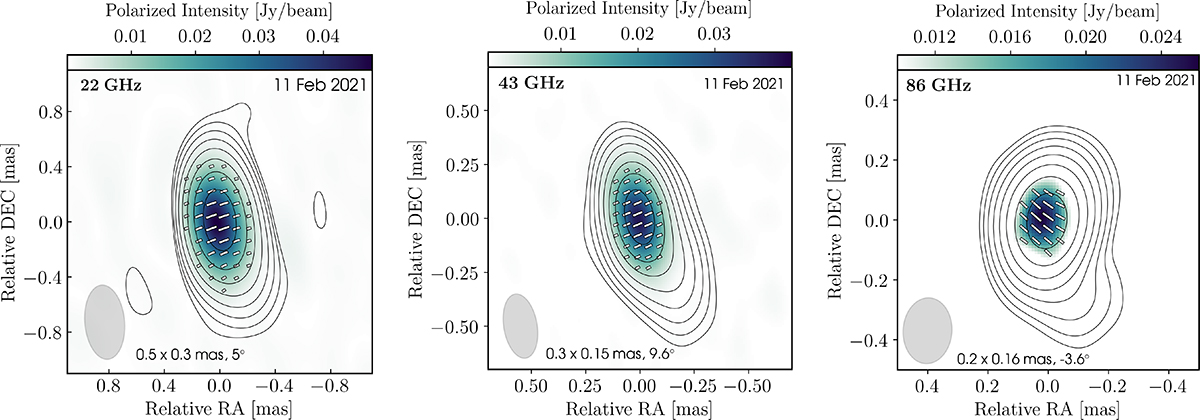
Polarization images of TXS 2013+370 observed on 11 February 2021. Left: Polarized-intensity map at 22 GHz with EVPA vectors (white sticks) overplotted. Middle: Polarization image at 43 GHz. Right: Polarization image at 86 GHz. Contours are at 0.5, 1, 2, 4, 8, 16, 32, and 64% of each panel’s peak (22 GHz: 1.31 Jy /beam; 43 GHz: 0.80 Jy /beam; 86 GHz: 0.70 Jy /beam), and they represent the total intensity contours. The restoring beam is shown as a gray ellipse in the lower-left corner.
Current usage metrics show cumulative count of Article Views (full-text article views including HTML views, PDF and ePub downloads, according to the available data) and Abstracts Views on Vision4Press platform.
Data correspond to usage on the plateform after 2015. The current usage metrics is available 48-96 hours after online publication and is updated daily on week days.
Initial download of the metrics may take a while.