Fig. 5.
Download original image
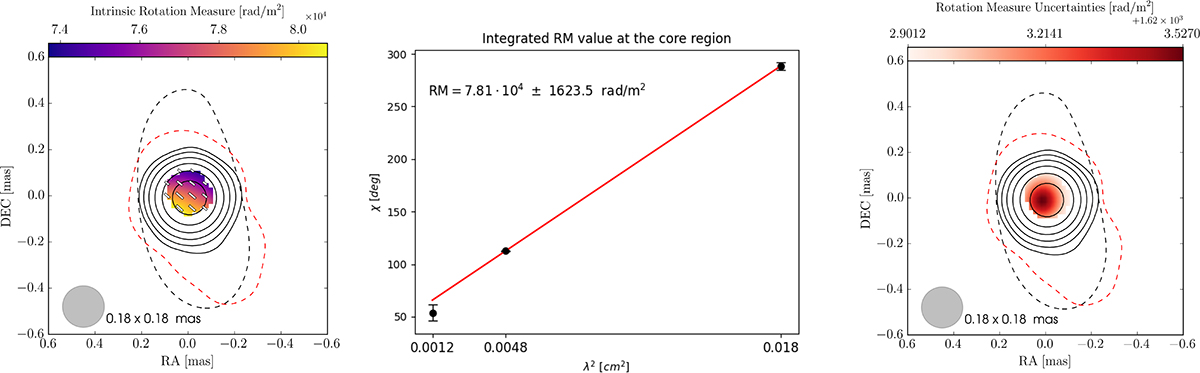
Faraday rotation results for the blazar TXS 2013+370. Left: Pixel-based map of intrinsic RM. Dashed lines correspond to the outermost total intensity contours of the 22 GHz (black) and 43 GHz (red) maps. Solid contours are set to 2, 4, 8, 16, 32, and 64% of the 86 GHz peak polarized intensity (0.70 Jy /beam). All maps have been convolved with a common beam, the equivalent circular beam of the 86 GHz map, which is shown as a gray circle in the bottom-left corner. Middle: Linear fit of Eq. (1) after unwrapping the nπ ambiguities showing EVPA rotation from 86 GHz to 22 GHz. The slope yields an integrated RM of (7.81 ± 0.16)×104 rad m−2 for the core region. Right: Pixel-based map of RM uncertainties from the covariance matrix of the per-pixel least-square fits.
Current usage metrics show cumulative count of Article Views (full-text article views including HTML views, PDF and ePub downloads, according to the available data) and Abstracts Views on Vision4Press platform.
Data correspond to usage on the plateform after 2015. The current usage metrics is available 48-96 hours after online publication and is updated daily on week days.
Initial download of the metrics may take a while.