Open Access
Fig. 6.
Download original image
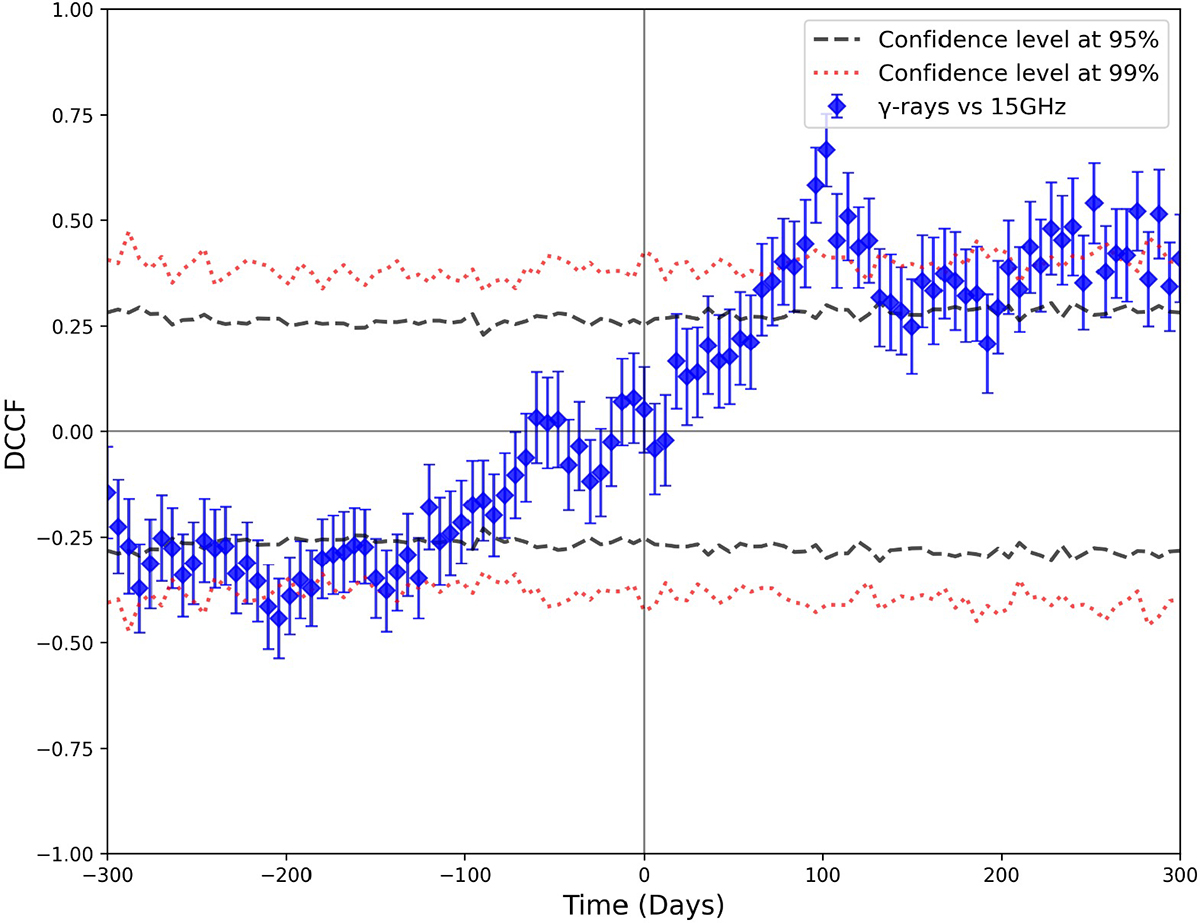
Results of the DCCF between the γ-ray and 15 GHz light curves. Positive time lags indicate that γ-ray activity leads the activity in radio. The significance of the correlations is displayed by a dashed line for the 2σ level and by a dotted line for the 3σ level.
Current usage metrics show cumulative count of Article Views (full-text article views including HTML views, PDF and ePub downloads, according to the available data) and Abstracts Views on Vision4Press platform.
Data correspond to usage on the plateform after 2015. The current usage metrics is available 48-96 hours after online publication and is updated daily on week days.
Initial download of the metrics may take a while.