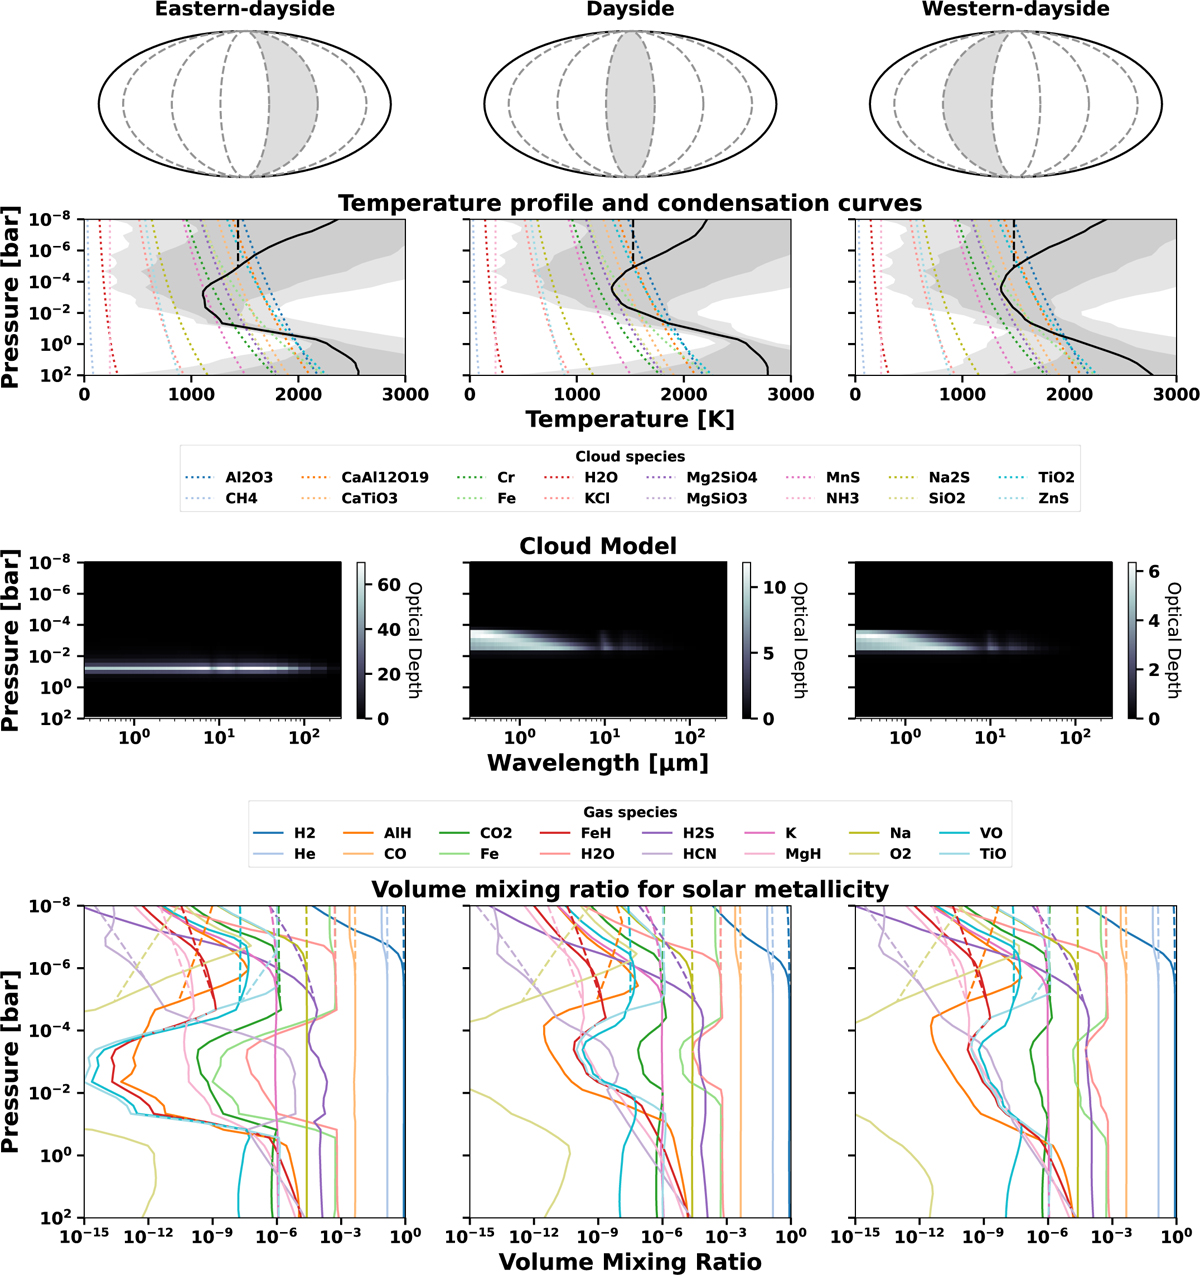
Fig. A.1
Download original image
The inputs used to create the self-consistent spectra with PICASO for each atmospheric segment (top row). The second row shows the temperature-pressure profiles of each segment with the solid line indicating the original profile and the shaded regions the one and two sigma errors. The dash line indicates the modification to the profile for the isothermal models. The dotted lines are the condensation curves for different cloud species. Previous works have favoured the presence of Mg2SiO4 and MgSiO3 clouds over those of other types (Hoyer et al. 2023; Radica et al. 2024; Coulombe et al. 2025; Radica et al. 2025) thus we only consider Mg2SiO4 and MgSiO3 clouds in our models. The third row shows the optical depth per atmospheric layer of the modelled Mg2SiO4 and MgSiO3 clouds as a function of wavelength. In the eastern dayside model, the top of the cloud deck forms at 10−1∙5 bar and for the other two segments it is at 10−4 bar. The last row shows the VMRs of all the species used in these models for 10 times solar metallicity. These assume equilibrium chemistry with the original temperature profile (solid lines) and modified profile (dashed lines).
Current usage metrics show cumulative count of Article Views (full-text article views including HTML views, PDF and ePub downloads, according to the available data) and Abstracts Views on Vision4Press platform.
Data correspond to usage on the plateform after 2015. The current usage metrics is available 48-96 hours after online publication and is updated daily on week days.
Initial download of the metrics may take a while.