Fig. 2
Download original image
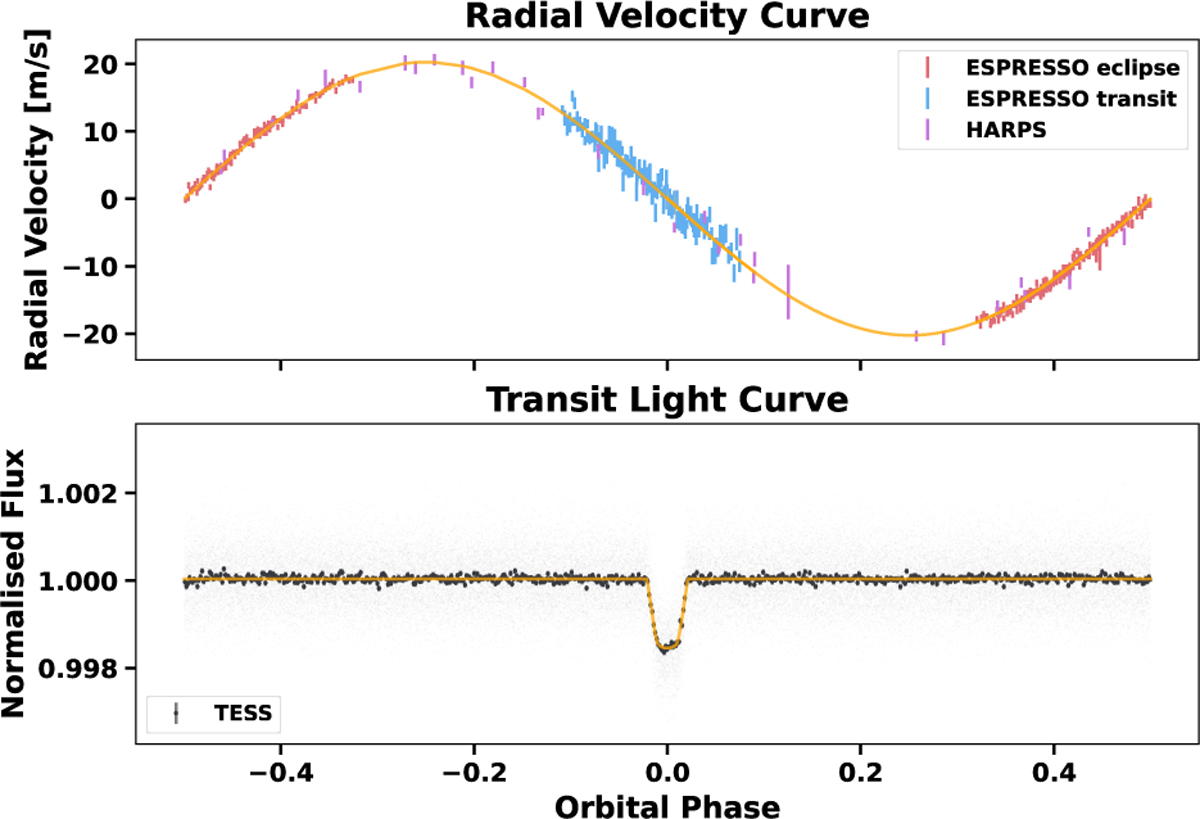
Top panel: phase-folded radial velocity curve comprised of radial velocity measurements from this work (ESPRESSO eclipse), ESPRESSO transit observations, and HARPS. The vertical extent of each point represents the error. For the radial velocities to appear as a continuous curve, the systemic velocity and the fitted instrumental offset were subtracted. Bottom panel: phase-folded short-cadence TESS light curve (light points). The darker points show a binned version of the curve. In both panels, the best-fit curve for a circular orbit is shown (orange).
Current usage metrics show cumulative count of Article Views (full-text article views including HTML views, PDF and ePub downloads, according to the available data) and Abstracts Views on Vision4Press platform.
Data correspond to usage on the plateform after 2015. The current usage metrics is available 48-96 hours after online publication and is updated daily on week days.
Initial download of the metrics may take a while.