Fig. 4
Download original image
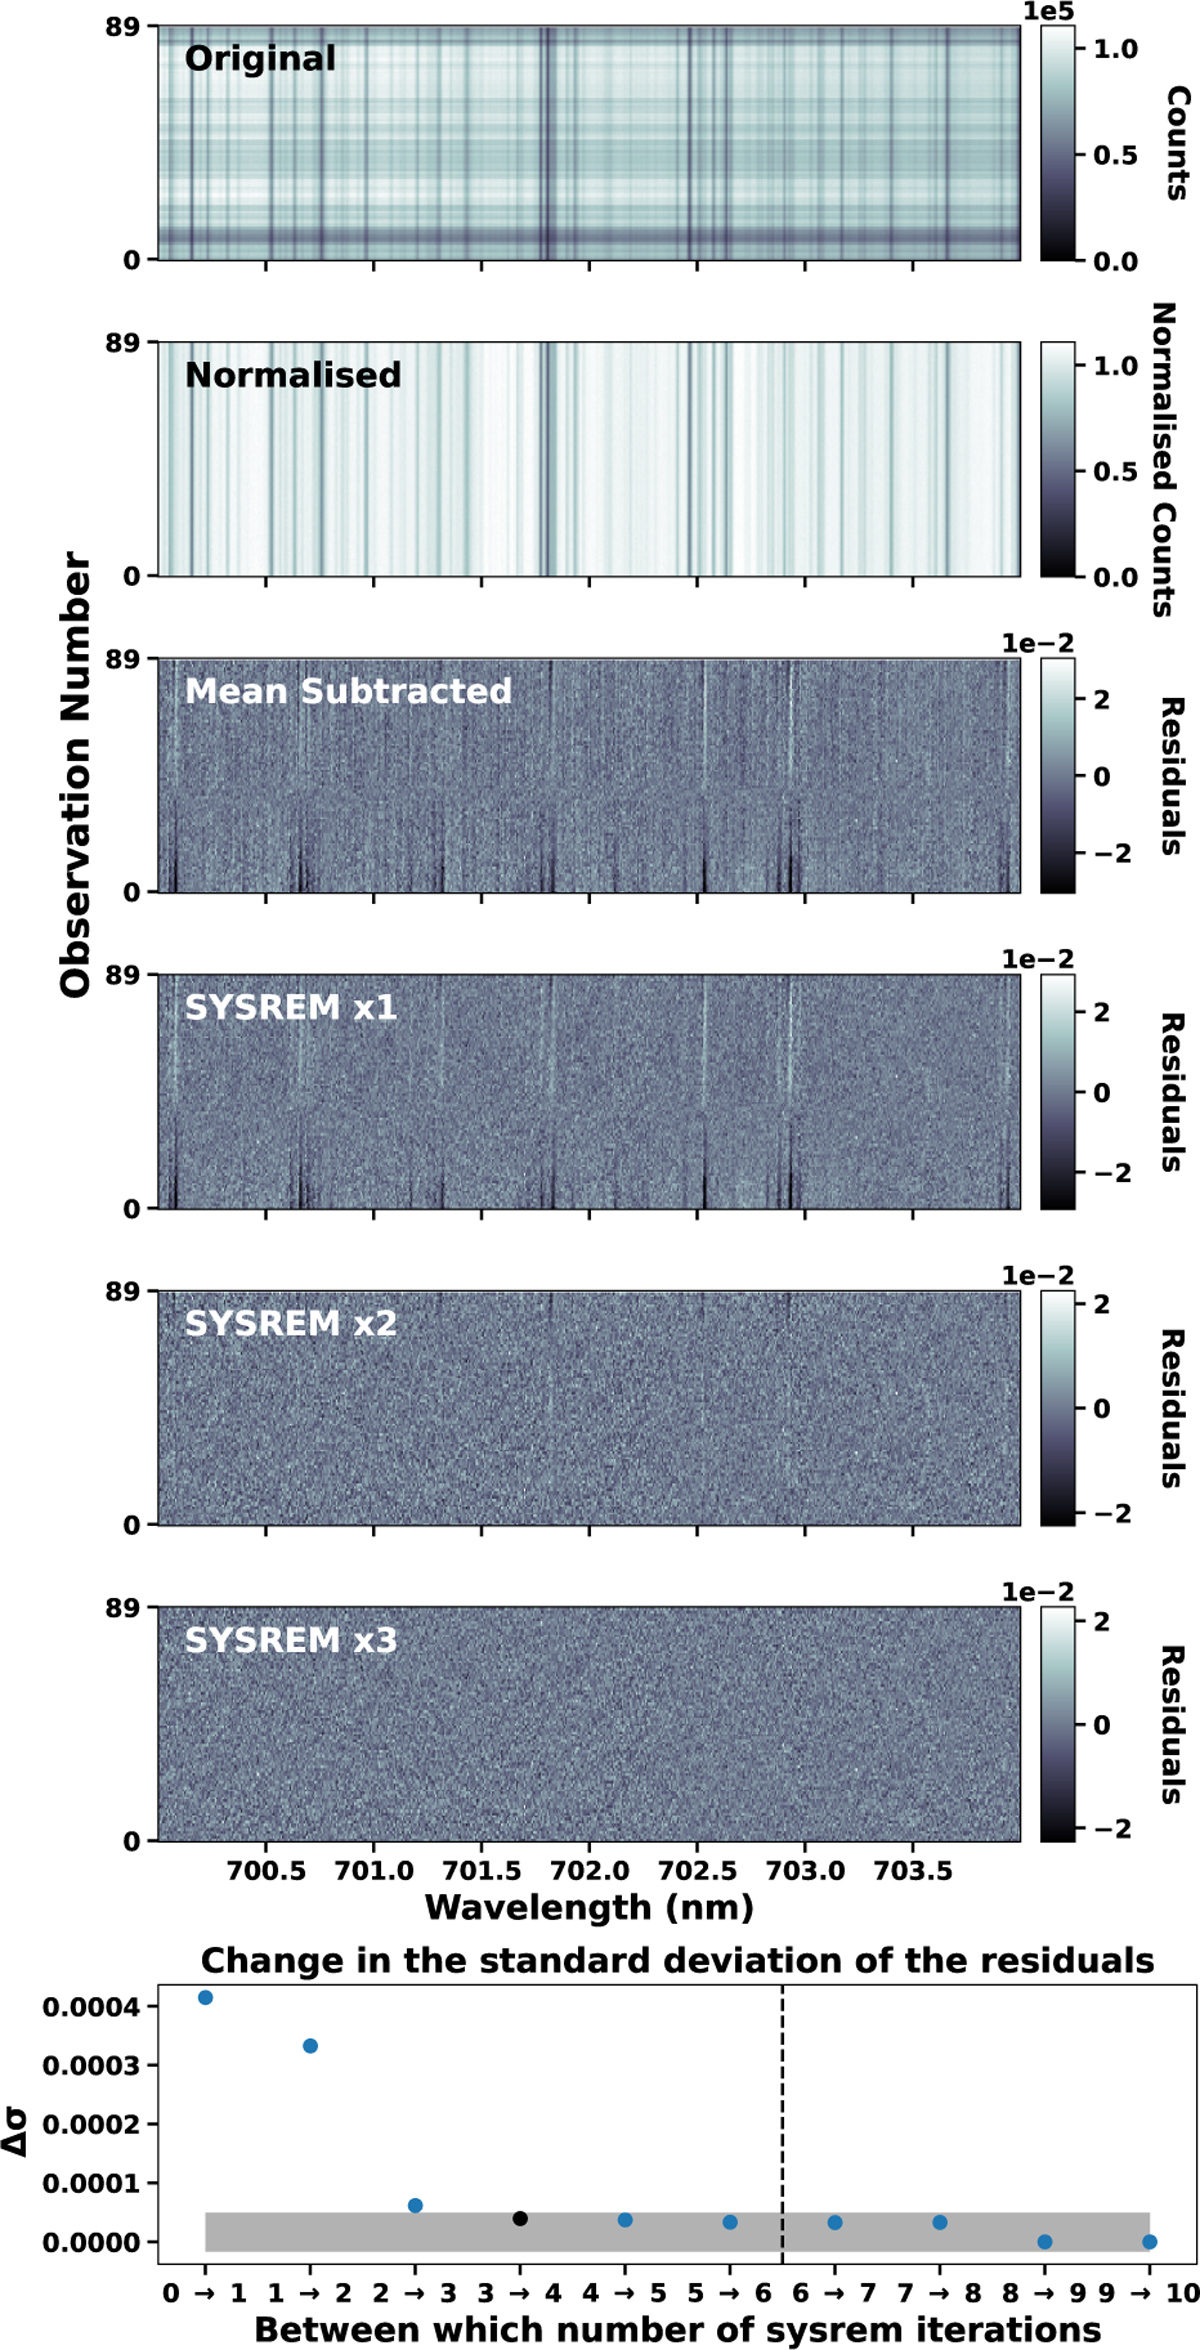
Schematic of the data reduction process for the spectral time series of order 76 in night 2. Each of the six top panels shows the time series of spectra. Each row represents one spectrum in the series. Top panel: original spectra. Second panel from the top: spectral time series after continuum normalisation. Third panel from the top: spectral time series after the mean spectrum was subtracted. Panels 4-6 from the top: Spectral time series after one, two, and three sysrem iterations were run on the time series. Bottom panel: difference in the standard deviation of the residuals between consecutive sysrem iterations as a function of the number of sysrem components. The shaded region highlights the one-sigma deviation in the last four points (to the right of the dashed line), and the black dot indicates the chosen number of iterations (the smaller number), as described in the text.
Current usage metrics show cumulative count of Article Views (full-text article views including HTML views, PDF and ePub downloads, according to the available data) and Abstracts Views on Vision4Press platform.
Data correspond to usage on the plateform after 2015. The current usage metrics is available 48-96 hours after online publication and is updated daily on week days.
Initial download of the metrics may take a while.