Fig. 6
Download original image
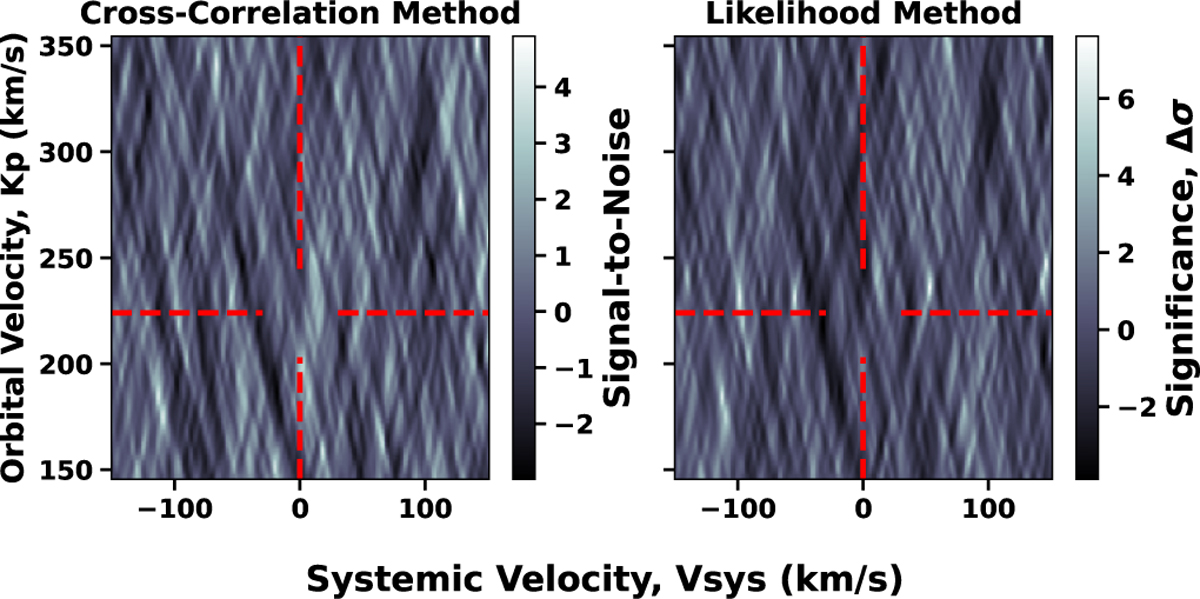
Vyys-Kp maps for the self-consistent 100 times solar dayside model for the original temperature profile (T.1). Left panel: Vsys-Kp map in terms of the S/Np computed from the cross-correlation coefficients. Right panel: Vsys-Kp map in terms of the significance computed from the likelihood (see Sect. 5.4). Neither map shows a significant peak at the known orbital parameters of the planet (Vsys = 0kms−1, Kp = 224kms−1), indicated by the crosshairs.
Current usage metrics show cumulative count of Article Views (full-text article views including HTML views, PDF and ePub downloads, according to the available data) and Abstracts Views on Vision4Press platform.
Data correspond to usage on the plateform after 2015. The current usage metrics is available 48-96 hours after online publication and is updated daily on week days.
Initial download of the metrics may take a while.