Fig. 7
Download original image
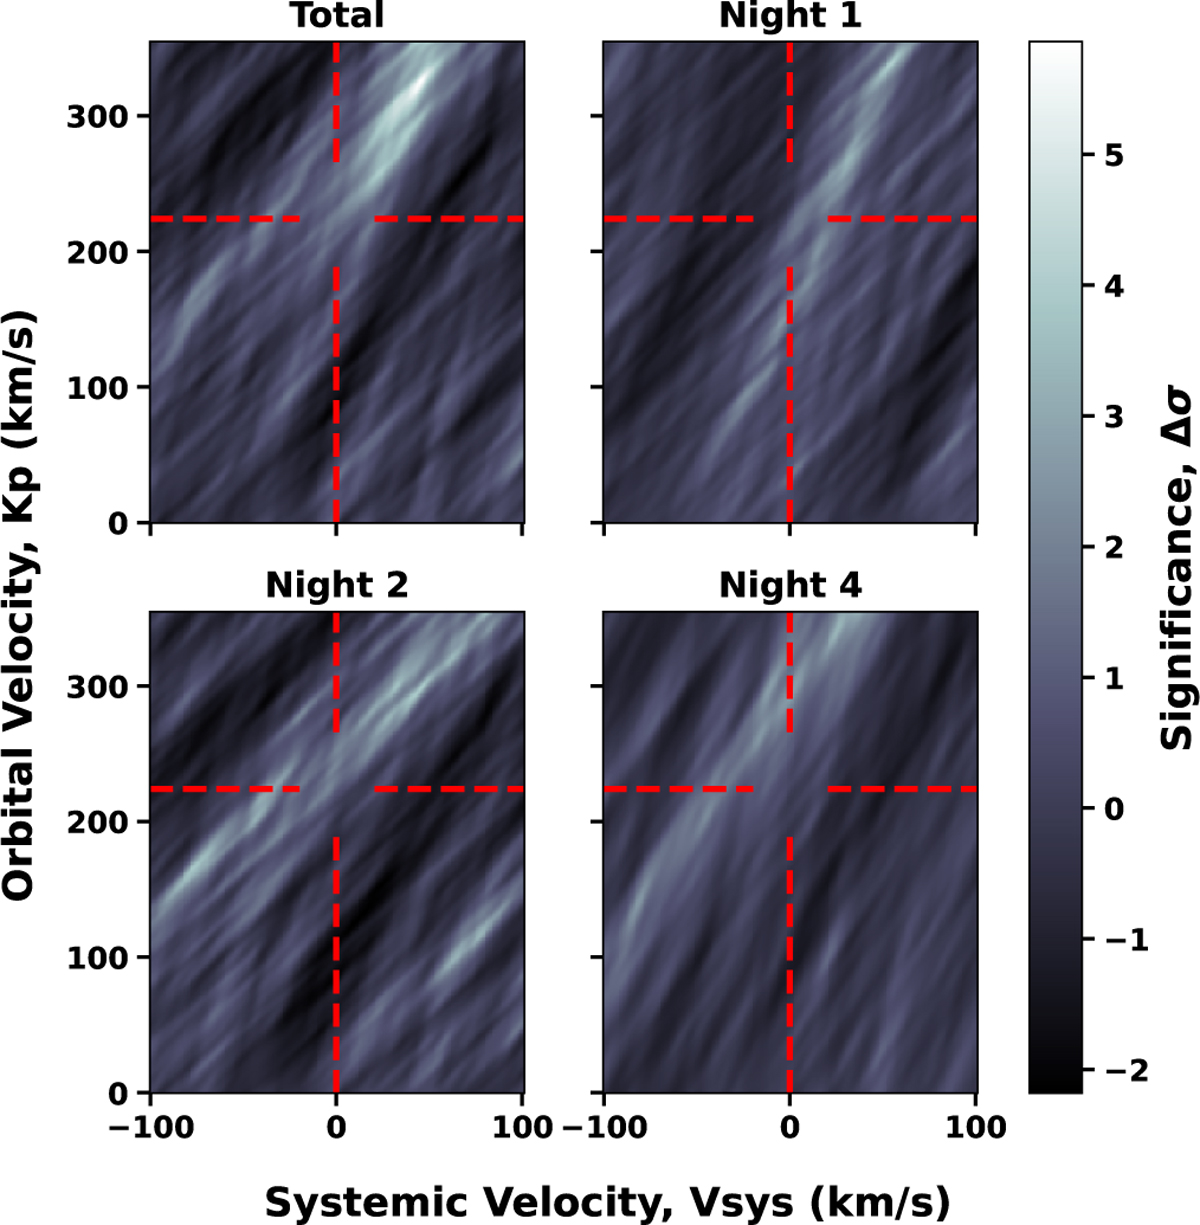
Top left panel: Vsys-Kp map for for the single-species Fe model with a VMR of 0.01 and a cloud top pressure of 10−1∙5 bar for all post-eclipse data containing a significant false-positive signal. The red crosshairs indicate the expected location of the planetary signal. The remaining three panels show the corresponding maps for each of the observing nights individually. There is no map for night 3 as no posteclipse data were taken.
Current usage metrics show cumulative count of Article Views (full-text article views including HTML views, PDF and ePub downloads, according to the available data) and Abstracts Views on Vision4Press platform.
Data correspond to usage on the plateform after 2015. The current usage metrics is available 48-96 hours after online publication and is updated daily on week days.
Initial download of the metrics may take a while.