Fig. 8
Download original image
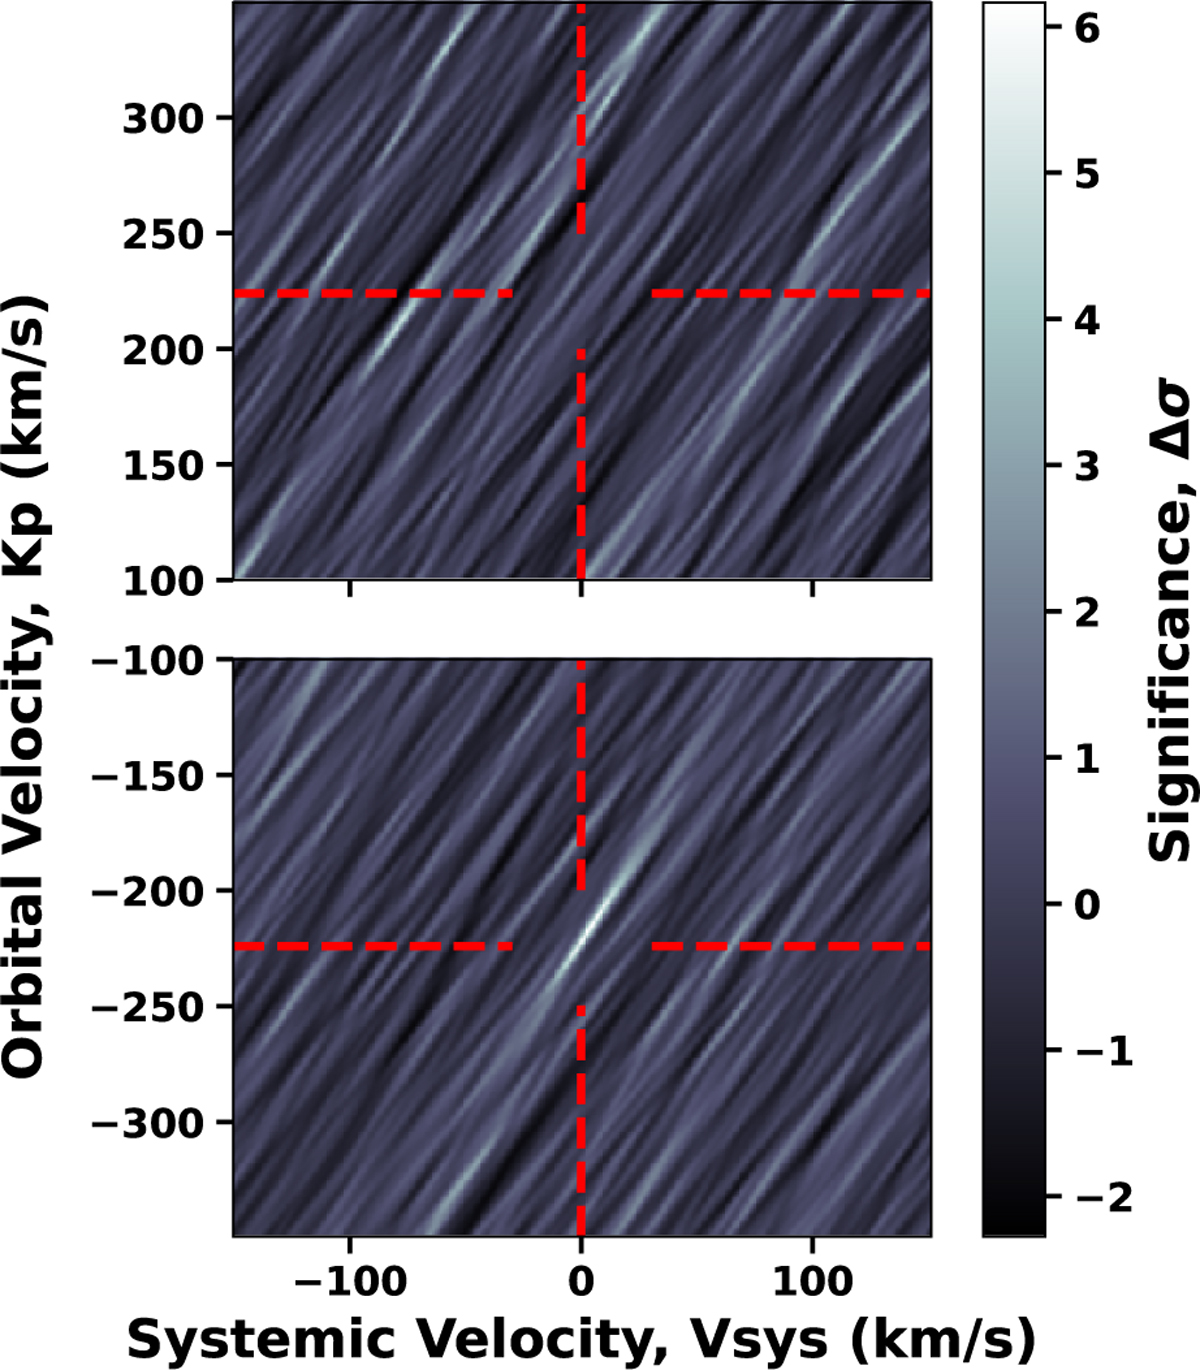
Example of an injection-recovery test. Top panel: Vsys-Kp map when the true observations are compared to the self-consistent 100 times solar western dayside model with the original temperature profile. Bottom panel: Vsys-Kp map when the same model was injected into the data at a negative orbital velocity (reversed y -axis). The expected location of the signal is indicated by the crosshairs in both panels.
Current usage metrics show cumulative count of Article Views (full-text article views including HTML views, PDF and ePub downloads, according to the available data) and Abstracts Views on Vision4Press platform.
Data correspond to usage on the plateform after 2015. The current usage metrics is available 48-96 hours after online publication and is updated daily on week days.
Initial download of the metrics may take a while.