Fig. 9
Download original image
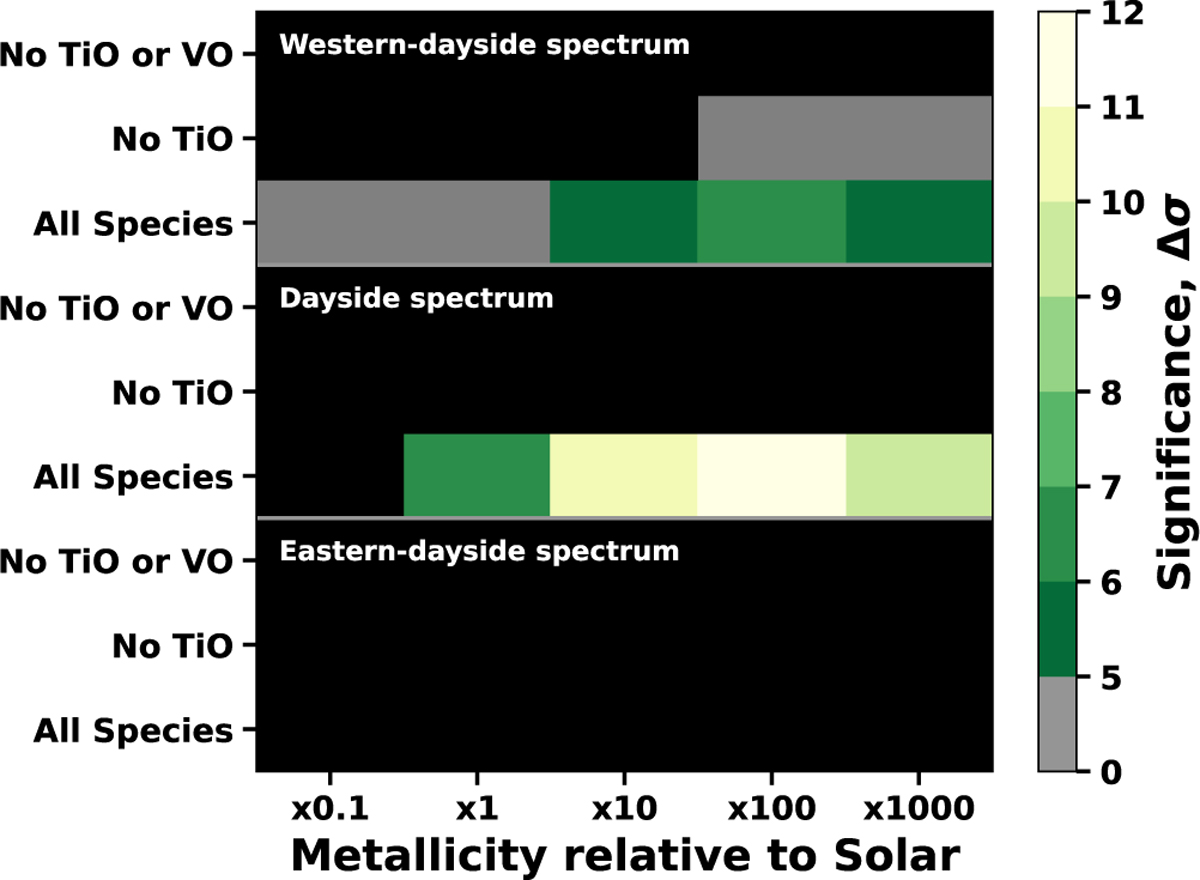
Results of the injection-recovery test on the self-consistent models with the original temperature profile (T.1 in Table 4). The black square indicates that the highest likelihood peak exceeded 50kms−1 in Vsys or Kp from the expected location of the injected orbit. The coloured squares indicate the significance (∆σ) at which the injected spectrum was recovered. The grey squares indicate the models that were recovered at ∆σ < 5.
Current usage metrics show cumulative count of Article Views (full-text article views including HTML views, PDF and ePub downloads, according to the available data) and Abstracts Views on Vision4Press platform.
Data correspond to usage on the plateform after 2015. The current usage metrics is available 48-96 hours after online publication and is updated daily on week days.
Initial download of the metrics may take a while.