Fig. 1
Download original image
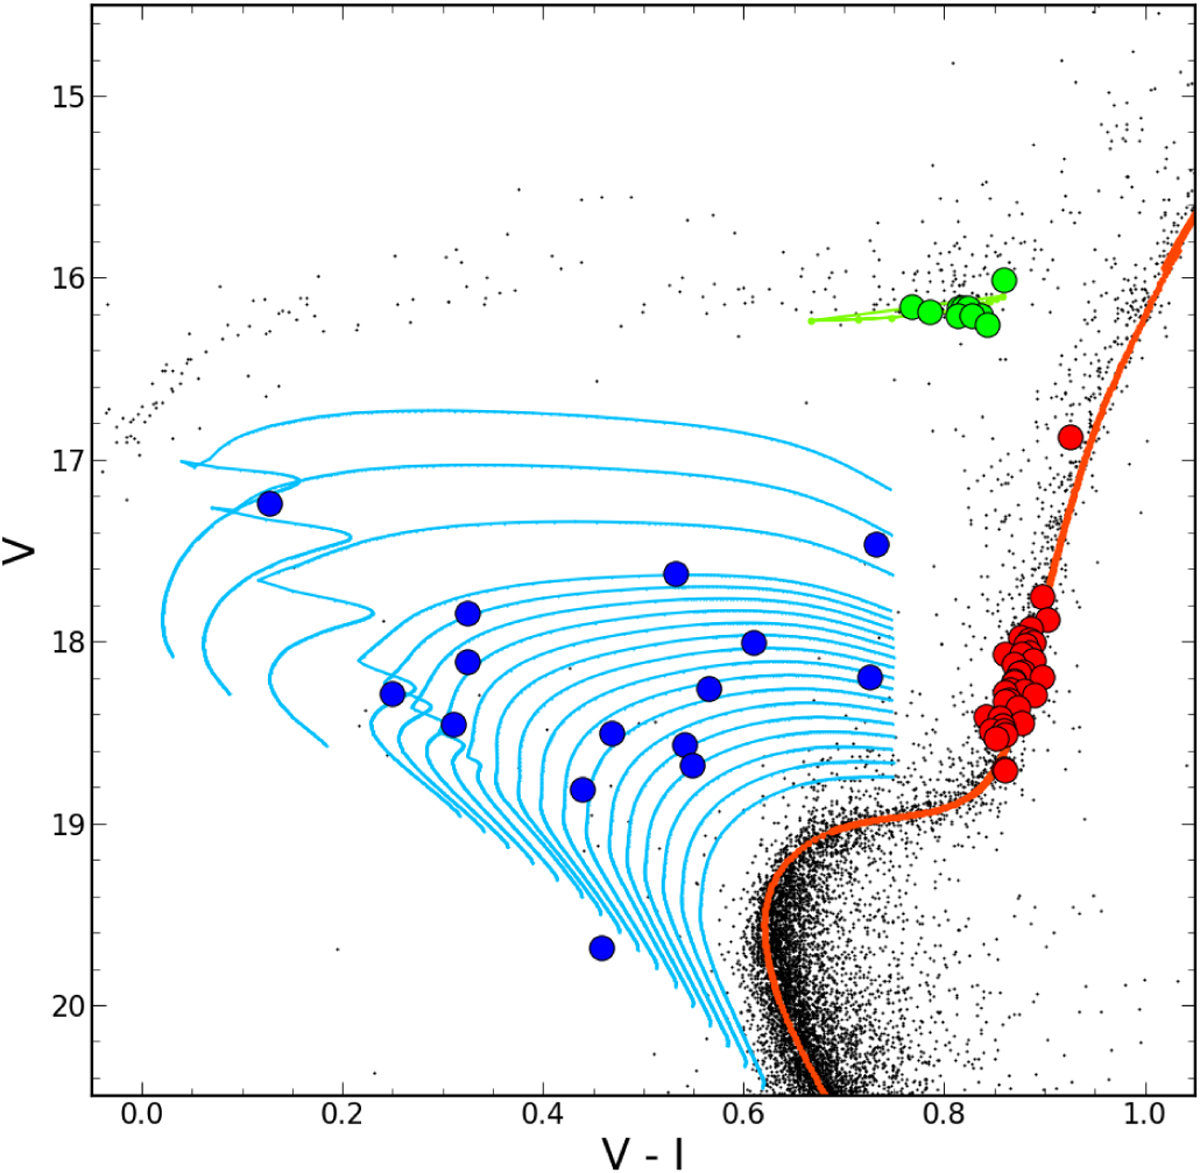
Color-magnitude diagram of NGC 1851 (black dots). The surveyed BSSs, RGB, and HB stars are plotted as blue, red, and green circles. A set of BASTI evolutionary tracks (Pietrinferni et al. 2021) with masses ranging from 0.9 to 1.5 M⊙ is overplotted as cyan lines. A BASTI isochrone of 11 Gyr is overplotted as an orange line, and a BASTI HB model is overplotted as a green line.
Current usage metrics show cumulative count of Article Views (full-text article views including HTML views, PDF and ePub downloads, according to the available data) and Abstracts Views on Vision4Press platform.
Data correspond to usage on the plateform after 2015. The current usage metrics is available 48-96 hours after online publication and is updated daily on week days.
Initial download of the metrics may take a while.