| Issue |
A&A
Volume 705, January 2026
|
|
|---|---|---|
| Article Number | A36 | |
| Number of page(s) | 7 | |
| Section | Galactic structure, stellar clusters and populations | |
| DOI | https://doi.org/10.1051/0004-6361/202557251 | |
| Published online | 06 January 2026 | |
Fast-rotating blue straggler stars in the globular cluster NGC 1851
1
Dipartimento di Fisica e Astronomia, Università degli Studi di Bologna,
Via Gobetti 93/2,
40129
Bologna,
Italy
2
INAF, Osservatorio di Astrofisica e Scienza dello Spazio di Bologna,
Via Gobetti 93/3,
40129
Bologna,
Italy
3
Universidad Andres Bello, Facultad de Ciencias Exactas, Departamento de Física y Astronomía – Instituto de Astrofísica, Autopista Concepcíon-Talcahuano
7100,
Talcahuano,
Chile
4
INAF-OATs,
Via G.B.Tiepolo 11,
Trieste
34143
Italy
5
Departamento de Física, Universidad de Santiago de Chile, Av. Víctor Jara
3493,
Santiago,
Chile
★ Corresponding author: This email address is being protected from spambots. You need JavaScript enabled to view it.
Received:
15
September
2025
Accepted:
10
November
2025
Abstract
We studied the rotational velocities of a sample of blue straggler stars (BSSs) and reference stars belonging to the Galactic globular cluster NGC 1851 using high-resolution spectra acquired with FLAMES-GIRAFFE at the ESO/VLT. After field decontamination based on radial velocities and proper motions, the final sample of member stars was composed of 15 BSSs and 45 reference stars populating the red giant and horizontal branches of the cluster. In agreement with previous findings, the rotation of the reference stars is negligible in general (lower than 15 km s−1). In contrast, the rotational velocity is high (up to ~150 km s−1) for a subsample of BSSs. We found 4 fast-rotating BSSs (defined as stars that spin faster than 40 km s−1), which corresponds to a percentage of 27 ± 14%. This result delineates a monotonically decreasing trend (instead of a step function) between the percentage of fast-spinning BSSs and the central concentration and density of the host cluster. This supports a scenario in which recent BSS formation preferentially occurs in low-density environments from the evolution of binary systems.
Key words: techniques: spectroscopic / blue stragglers / stars: rotation / globular clusters: general
© The Authors 2026
 Open Access article, published by EDP Sciences, under the terms of the Creative Commons Attribution License (https://creativecommons.org/licenses/by/4.0), which permits unrestricted use, distribution, and reproduction in any medium, provided the original work is properly cited.
This article is published in open access under the Subscribe to Open model. This email address is being protected from spambots. You need JavaScript enabled to view it. to support open access publication.
1 Introduction
Blue straggler stars (BSSs) are an exotic population in globular clusters (GC; Sandage 1953; Ferraro et al. 1997, 1999) and other stellar environments (Mathieu & Geller 2009; Momany et al. 2007; Mapelli et al. 2009; Preston & Sneden 2000; Clarkson et al. 2011). In the color-magnitude diagram (CMD), they lie on an extension of the main sequence (MS), and they are bluer (hotter) and brighter than the MS turnoff. Hence, they are more massive than MS stars (e.g., Shara et al. 1997; Geller & Mathieu 2011; Fiorentino et al. 2014).
Because of their high mass, BSSs are affected by dynamical friction, which causes them to progressively migrate to the central regions of the cluster. Ferraro et al. (2012) presented a method (named “dynamical clock”) that uses the BSS radial distribution to derive the dynamical age of star clusters. The dynamical evolution of the host cluster is efficiently traced by the ![Mathematical equation: $\[A_{r h}^{+}\]$](/articles/aa/full_html/2026/01/aa57251-25/aa57251-25-eq1.png) parameter (Alessandrini et al. 2016; Lanzoni et al. 2016), which is defined as the area between the cumulative radial distribution of BSSs and that of a lighter stellar population of the cluster, such as MS, red giant branch (RGB), or horizontal branch (HB) stars. Therefore, this parameter describes the BSS central segregation with respect to that of the lighter population. Because only one burst of star formation occurred in globular (and open) clusters, mass-enhancement processes must be at the origin of these peculiar objects. Three formation scenarios have been proposed for this so far: mass transfer from a companion star to the proto-accreting BSS in binary systems (MT-BSS; McCrea 1964), direct collisions between two or more stars (COL-BSS; Hills & Day 1976; Sills et al. 2005), and mergers or collisions triggered by dynamical interactions or stellar evolution in triple star systems (Andronov et al. 2006; Perets & Fabrycky 2009).
parameter (Alessandrini et al. 2016; Lanzoni et al. 2016), which is defined as the area between the cumulative radial distribution of BSSs and that of a lighter stellar population of the cluster, such as MS, red giant branch (RGB), or horizontal branch (HB) stars. Therefore, this parameter describes the BSS central segregation with respect to that of the lighter population. Because only one burst of star formation occurred in globular (and open) clusters, mass-enhancement processes must be at the origin of these peculiar objects. Three formation scenarios have been proposed for this so far: mass transfer from a companion star to the proto-accreting BSS in binary systems (MT-BSS; McCrea 1964), direct collisions between two or more stars (COL-BSS; Hills & Day 1976; Sills et al. 2005), and mergers or collisions triggered by dynamical interactions or stellar evolution in triple star systems (Andronov et al. 2006; Perets & Fabrycky 2009).
The MT channel is favored in low-density environments, possibly because binary systems can more easily survive in low-density conditions. Mathieu & Geller (2009) found that 76 ± 19% (a fraction that is compatible with 100%) of BSSs in the old open cluster NGC 188 are in binary systems. In addition, Sollima et al. (2008) found an intriguing correlation between the BSS specific frequency and the binary fraction in the core of 13 low-density Galactic GCs. Moreover, Ferraro et al. (2025) recently found evidence that the origin of the vast majority of BSSs detected in Galactic GCs is related to binaries (see also Knigge et al. 2009). This indicates that the MT process is the most efficient formation channel in GCs as well.
It is hard to distinguish between MT-BSSs and COL-BSSs based on observations. Photometrically, a far-ultraviolet excess was detected in a few binary BSSs in NGC 188 (Gosnell et al. 2014, 2015; Subramaniam et al. 2016) and other open and globular clusters (e.g. Sahu et al. 2019; Dattatrey et al. 2023; Reggiani et al. 2025, and references therein). This was interpreted as the signature of hot white dwarf companions, which are remnants of the MT activity that generated these BSSs. Moreover, the BSS population in a few post-core-collapse GCs was observed to be split in two well-separated and parallel sequences (Ferraro et al. 2009; Dalessandro et al. 2013; Beccari et al. 2019; Cadelano et al. 2022; see also Simunovic et al. 2014 and Raso et al. 2020). The bluest sequence is thought to be mainly populated by COL-BSSs that formed in a sudden enhancement of the collision activity during the core-collapse phase, while the reddest sequence is interpreted as predominantly due to MT-BSSs (Ferraro et al. 2009; Xin et al. 2015; Portegies Zwart 2019, see). The presence of a double BSS sequence has also been claimed in some open clusters (see, e.g, Rao et al. 2023, Wang et al. 2025, and references therein, but see also Dalessandro et al. 2019), however, which challenges the previous interpretation because the low-density environment of open clusters disfavors the formation of COL-BSSs. One intriguing suggestion (Rao et al. 2023) is that one sequence is populated by slowly rotating stars and the other by fast-rotating stars. Further investigations are needed to confirm the hypothesis. Another possibility suggested by Rao et al. (2023) is the presence of multiple populations.
An alternative way for distinguishing MT-BSSs from those that formed via collision is through the spectroscopic study of the surface chemical composition. MT-BSSs are predicted to show surface depletion in carbon and oxygen through the accretion of material that was processed deep in the interior of the companion star (Sarna & De Greve 1996), while no chemical anomalies are expected in the COL scenario (Lombardi et al. 1995). The chemical signature of MT formation has been observed in subsamples of BSSs belonging to the GCs 47 Tucanae (Ferraro et al. 2006) and M30 (Lovisi et al. 2013a). Interestingly, the chemical (CO-depletion) and photometric (UV-excess) signatures have been detected for the first time in the same BSS in 47 Tucanae (Reggiani et al. 2025). Moreover, recent studies in open clusters detected a barium enhancement in a sub-sample of BSSs (Milliman et al. 2015; Nine et al. 2024). This feature has been interpreted as the signature of MT between an asymptotic giant branch companion that polluted the surface of the BSS with elements produced during the thermal pulses.
The study of rotational velocities can also add important information on the BSS origin and might shed light on the link between the BSS evolution and the environmental characteristics. In particular, high rotational velocities are expected at birth for both MT-BSSs (Sarna & De Greve 1996; de Mink et al. 2013) and COL-BSSs (Benz & Hills 1987; Sills et al. 2002). For the MT channel, the reason for the high velocity is the transfer of angular momentum from the companion star to the accreting proto-BSS, whereas in the COL scenario, the reason is the conservation of angular momentum. Braking mechanisms (e.g., magnetic braking and disk locking) are then expected to slow the stars down, but the timescales and efficiencies are not completely understood so far (Leonard & Livio 1995; Sills et al. 2005). New constraints are fortunately emerging from observations in open and globular clusters. A recent result in open clusters compared the rotation rates and ages of MT products to model the evolution of angular momentum with time. A timescale shorter than 1 Gyr was suggested for substantial braking (Leiner et al. 2018). A similar value (1–2 Gyr) has been inferred (Ferraro et al. 2023b) for COL-BSSs using the time since core collapse (estimated from the comparison between collisional models and the observed blue BSS sequence in M30; see Ferraro et al. 2009) as an estimate of the formation epoch of these stars. Although the rotational velocity cannot unequivocally indicate the formation scenario, it can therefore be used as an indicator of BSS age.
In this context, our group started an extensive high-resolution spectroscopic campaign several years ago to study the rotational velocities of these exotic stars in a sample of Galactic GCs with different values of the structural parameters. We have published the results for the BSS rotational velocities in eight systems so far, namely 47 Tucanae (Ferraro et al. 2006), M4 (Lovisi et al. 2010), NGC 6397 (Lovisi et al. 2012), M30 (Lovisi et al. 2013a), NGC 6752 (Lovisi et al. 2013b), ω Centauri1 (Mucciarelli et al. 2014), NGC 3201 (Billi et al. 2023), and M55 (Billi et al. 2024). This dataset includes about 300 BSSs. Ferraro et al. (2023a) found a strong relation in this dataset between the fraction of fast-rotating BSSs (FR-BSSs) and the structural parameters (e.g., King concentration and central density) of the host cluster. FR-BSSs were defined as stars with v sin(i) ≥ 40 km s−1, where i is the inclination angle in the plane of the sky2. For low-density and low-concentration clusters, the fraction of FR-BSSs is much higher than is observed in dense and more concentrated systems. This suggests that the environment affects the formation and evolution of BSSs (see also Ferraro et al. 2025).
In this paper, we present new results on the rotational velocities of BSSs and of a reference sample composed of RGB and HB stars in the GC NGC 1851. This cluster has an intermediate value of the concentration (c = 1.86) and a high value of central density (log ρ0 = 5.09 in units of L⊙ pc−3). It is the first cluster in our sample with an intermediate King concentration for which the BSS rotational velocities were measured, and it thus fills the gap between high- and low-concentration systems. The paper is organized in the following sections. Sect. 2 describes the observations and data reduction. The atmospheric parameters are determined in Sect.3. Sect. 4 discusses the membership of stars based on radial velocities and proper motions. In Sects. 5 and 6, we present our results for the rotational velocity of BSSs and reference stars, and we conclude our study.
2 Observations
This work is based on stellar spectra obtained with the high-resolution multi-object spectrograph FLAMES3 GIRAFFE (Pasquini et al. 2002) mounted on the Very Large Telescope at European Southern Observatory (ESO) Paranal Observatory, under programs 090.D-0487(A) and 092.D-0477(A) (PI: Simunovic). The observations were performed in different nights between November 2012 and October 2013 using the HR9A setup, which covers the wavelength interval Δλ = 5095–5404 Å and samples the Mgb triplet lines (λ1 = 5167.4 Å, λ2 = 5172.7 Å, and λ3 = 5183.6 Å). These three lines are very sensitive to v sin(i), as demonstrated in recent studies on BSS rotational velocities (see Mucciarelli et al. 2014; Billi et al. 2023). A total of 15 exposures are available in the ESO archive, and the acquired spectra belong to stars that evolve in different evolutionary stages: BSSs, RGB, and HB stars (see Figure 1, where the adopted photometric catalog is from Stetson et al. 2019). We took the reduced spectra from the online ESO archive4. Then, we computed a master-sky as the median of the sky spectra in the available exposures, and we subtracted it from the observed spectra. Finally, we corrected for the heliocentric velocity and averaged the individual exposures of the same stars. The resulting signal-to-noise ratio (S/N) ranges between 10 and 30 for the sampled BSSs and RGB stars, and it is between 30 and 50 for the HB stars.
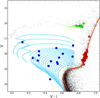 |
Fig. 1 Color-magnitude diagram of NGC 1851 (black dots). The surveyed BSSs, RGB, and HB stars are plotted as blue, red, and green circles. A set of BASTI evolutionary tracks (Pietrinferni et al. 2021) with masses ranging from 0.9 to 1.5 M⊙ is overplotted as cyan lines. A BASTI isochrone of 11 Gyr is overplotted as an orange line, and a BASTI HB model is overplotted as a green line. |
3 Atmospheric parameters
Atmospheric parameters (e.g., effective temperature, Teff, and surface gravity, log g) are fundamental ingredients for the computation of appropriate synthetic spectra to be compared with the observed spectra, from which radial and rotational velocities are then measured. They were estimated by comparing the position of the surveyed stars in the CMD with evolutionary tracks, isochrones, and an HB model. The models were retrieved from the online BASTI-IAC database (Pietrinferni et al. 2021), adopting an α-enhanced mixture and metallicity [Fe/H] = −1.18 dex (Harris 1996, 2010 edition). A set of evolutionary tracks with mass values ranging from 0.9 to 1.5 M⊙ was used for BSSs, while the atmospheric parameters of HB and RGB stars were estimated through the comparison with an HB model including stellar masses of 0.65–0.8 M⊙ and an 11 Gyr old (VandenBerg et al. 2013) isochrone, respectively. The models are plotted in the observed CMD (see Figure 1) by adopting a distance modulus (m − M)V = 15.47 and reddening E(B − V) = 0.02 (Harris 1996, 2010 edition).
To estimate the BSS temperatures and surface gravities, we orthogonally projected the observed CMD position of each star onto the closest evolutionary track. For the BSSs, the resulting temperatures and log g values range between 5700 and 8600 K and between 3.4 and 4.2 dex. For RGB, stars we obtained Teff values between 5030 and 5350 K, and log g = [3.3, 3.6] dex. Finally, for HB stars, we find Teff = [5300, 5600] K and log g = [2.4, 2.5] dex. We assumed a microturbulence of 1 km s−1 for BSSs and HB stars, and for RGB stars, we adopted 1.5 km s−1.
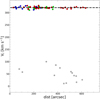 |
Fig. 2 Radial velocity of the observed stars as a function of their distance from the cluster center. BSSs, RGB, and HB member stars are marked as blue, red, and green circles, respectively. The gray circles correspond to Galactic field interlopers. The dashed black line marks the average radial velocity of the member star sample. |
4 Radial velocities and cluster membership
The radial velocities (Vr) were used to assess the cluster membership of the observed stars. We measured them by cross-correlating between the observed and template spectra using the IRAF task fxcor (Tonry & Davis 1979). As templates, we used synthetic spectra calculated using the code SYNTHE (Sbordone et al. 2004; Kurucz 2005), and we assumed different atmospheric parameters for the different types of stars. For the atomic and molecular transitions, we used the last version of the Kurucz & Castelli linelist5. The model atmospheres were calculated with the ATLAS9 code (Kurucz 1993; Sbordone et al. 2004) under the assumptions of local thermodynamic equilibrium and plane-parallel geometry, adopting the opacity distribution functions by Castelli & Kurucz (2003) without the approximate overshooting prescription (Castelli et al. 1997).
Figure 2 shows the distribution of the measured radial velocities as a function of the distance from the center. The radial velocities of 14 objects are clearly inconsistent with the radial velocity of the bulk population, and the stars are clearly Galactic field interlopers. Hence, they were excluded from the following analysis. The remaining stars are tightly aligned around a mean radial velocity of 320.3 ± 0.5 km s−1 (dashed black line in Figure 2). This value is well consistent with the systemic velocity of NGC 1851 quoted in the literature: 320.5 ± 0.6 km s−1 (Harris 1996, 2010 edition) and 321.4 ± 1.6 km s−1 (Baumgardt & Hilker 2018). They all lie within 3σ of the distribution, with σ = 3.9 km s−1. To further confirm their cluster membership, we took the membership probability quoted by Vasiliev & Baumgardt (2021) into account that was estimated from Gaia DR3 proper motions (Gaia Collaboration 2016, 2023), and we found that their membership probability was higher than 90%. For one of the surveyed BSSs, we measured Vr = 287.8 km s−1. This is a very FR-BSS, however, and because its spectral lines are extremely broadened, the value we obtained is not reliable. The membership probability of this star (Gaia ID: 4819197058394790528) is >0.9 in Vasiliev & Baumgardt (2021), however, and we therefore kept it in the final sample of bona fide members, which includes a total of 15 BSSs, 35 RGB, and 10 HB stars.
Properties of the analyzed BSSs.
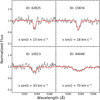 |
Fig. 3 Comparison between the observed spectrum (black line) and the best-fit synthetic spectrum (red line) of four BSSs with different rotational velocities (see labels). |
5 Rotational velocities
The rotational velocities were measured by comparing the normalized observed spectra with a grid of synthetic spectra calculated with the atmospheric parameters discussed above and with different values of v sin(i). More specifically, we selected the Mgb triplet lines, and in particular, we used the third line (λ3 = 5183.6 Å), which provides the best and clearest comparison. A χ2 minimization procedure was used to identify the best-fit solution. Figure 3 shows the comparison between the observed spectrum and the best-fit synthetic spectrum for the third line of the Mgb triplet for a sample of four BSSs with different values of the rotational velocities. Clearly, the broader the observed line, the higher the stellar rotational velocity. To estimate the uncertainties on v sin(i), we performed a Monte Carlo simulation. For each star, we calculated a synthetic spectrum with the proper atmospheric parameters and the best-fit value of v sin(i). Then, we randomly added Poissonian noise with the same S/N as for the observed spectrum and repeated the analysis described above. We thus derived a new best-fit value of v sin(i). By repeating the procedure 300 times, we obtained a distribution of v sin(i) values, and we finally adopted its standard deviation as the 1σ uncertainty on the rotational velocity of each star. Table 1 lists the values we obtained for each member BSS. The resolution is moderate and the S/N of the spectra is relatively low, and we were therefore not able to distinguish very slowly rotating stars (with v sin(i) < 15 km s−1). We therefore adopted an upper limit for these stars. RGBs and HBs rotate very slowly, as expected, with v sin(i) < 15 km s−1. This is consistent with the findings of previous studies (Billi et al. 2023, 2024; Ferraro et al. 2023a).
The distribution of v sin(i) values we obtained for the surveyed sample of BSSs is shown in Figure 4. The rotational velocity distribution of BSSs is different from those of normal cluster stars. All RGB and HB stars rotate more slowly than 15 km s−1, but some BSSs not only have v sin(i) values above this threshold, but even show rotational velocities exceeding 100 km s−1.
In particular, we found 4 FR-BSSs out of the 15 BSSs in NGC 1851, which corresponds to a total fraction of 27 ± 14%. The uncertainty on the fraction of FR-BSSs was calculated using the propagation of the uncertainty of a ratio.
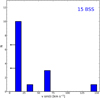 |
Fig. 4 Rotational velocity distribution of the 15 BSSs. The left arrows indicate the upper limit of 15 km s−1 adopted for very slowly rotating BSSs. |
6 Discussion and conclusions
As part of a spectroscopic survey of BSS rotational velocities in a sample of Galactic GCs spanning a wide range in structural parameters, we presented the results obtained in NGC 1851. As for other clusters, we found that BSSs have a peculiar rotational velocity distribution compared to standard cluster stars, which highlights their exotic origin. In particular, BSSs with v sin(i) of about 100 km s−1 or more have been detected in previous works (Lovisi et al. 2010; Mucciarelli et al. 2014; Billi et al. 2023, 2024), and one BSS with an extremely high rotational velocity (almost 150 km s−1) is also found in NGC 1851.
Figure 5 shows the position in the CMD of slowly and fast-rotating BSSs, while we plot in Figure 6 the cumulative distributions of the two subsamples as a function of the observed magnitude and color (left and right panels, respectively). Figure 6 also provides the p-values of the Kolmogorov-Smirnov test against the null hypothesis that the two samples are extracted from the same parent distribution. Unfortunately, the small size of the available samples prevented us from obtaining conclusive answers about the possible difference in the color and magnitude distributions of FR and slowly rotating BSSs.
A high rotational velocity is interpreted as the evidence of recent BSS formation, with braking mechanisms that had not enough time to intervene and slow down the stars. This piece of evidence might therefore suggest that brighter and bluer BSSs tend to be younger than the others, or that braking mechanisms tend to be less efficient in the former. We also searched for a possible correlation between the fraction of FR and the distance of the BSSs from the center of the cluster, as done in previous works (see Billi et al. 2023, 2024). In this case, we found no clear relation between these two parameters. Fast- and slowly rotating BSSs do not have two distinct radial distributions.
Ferraro et al. (2023a) found an intriguing relation between the fraction of FR-BSSs and the central concentration and density of the host cluster, which shows that low-concentration and low-density systems are populated by a larger fraction of fast-spinning BSSs (see the gray symbols in Figure 7). It remained unclear, however, whether this dependence was a sort of step function (with ~40% FR-BSSs for concentration parameters below ~2 and ~10% FR-BSSs above this limit) or a monotonically decreasing trend. The findings presented in this paper (blue circles in the figure) are an important addition to this result. They indicate a continuous drop in the fraction of fast-spinning BSSs for increasing c and ρ0.
Ferraro et al. (2023a) also discussed a possible relation between the fraction of FR-BSSs and the ![Mathematical equation: $\[A_{r h}^{+}\]$](/articles/aa/full_html/2026/01/aa57251-25/aa57251-25-eq2.png) parameter, which is defined (Alessandrini et al. 2016; Lanzoni et al. 2016) as the area between the cumulative radial distribution of BSSs and that of a reference population of lighter stars (e.g., HB or RGB stars) and measures the dynamical age of the host cluster (see Ferraro et al. 2018, 2023b, and references therein): the higher the value of
parameter, which is defined (Alessandrini et al. 2016; Lanzoni et al. 2016) as the area between the cumulative radial distribution of BSSs and that of a reference population of lighter stars (e.g., HB or RGB stars) and measures the dynamical age of the host cluster (see Ferraro et al. 2018, 2023b, and references therein): the higher the value of ![Mathematical equation: $\[A_{r h}^{+}\]$](/articles/aa/full_html/2026/01/aa57251-25/aa57251-25-eq3.png) , the higher the dynamical age of the cluster, with
, the higher the dynamical age of the cluster, with ![Mathematical equation: $\[A_{r h}^{+}\]$](/articles/aa/full_html/2026/01/aa57251-25/aa57251-25-eq4.png) > 0.3 possibly indicating stellar systems that already went through core collapse. The relation between the percentage of FR-BSSs and
> 0.3 possibly indicating stellar systems that already went through core collapse. The relation between the percentage of FR-BSSs and ![Mathematical equation: $\[A_{r h}^{+}\]$](/articles/aa/full_html/2026/01/aa57251-25/aa57251-25-eq6.png) found by Ferraro et al. (2023a) is plotted with gray symbols in Figure 8. It shows a clearly decreasing trend up to
found by Ferraro et al. (2023a) is plotted with gray symbols in Figure 8. It shows a clearly decreasing trend up to ![Mathematical equation: $\[A_{r h}^{+}\]$](/articles/aa/full_html/2026/01/aa57251-25/aa57251-25-eq7.png) ~0.3 and a possible mild increase for higher
~0.3 and a possible mild increase for higher ![Mathematical equation: $\[A_{r h}^{+}\]$](/articles/aa/full_html/2026/01/aa57251-25/aa57251-25-eq8.png) values. The latter behavior might be evidence for recently formed COL-BSSs that are generated by the strong density enhancement (hence, the growth in the stellar collision probability) during core collapse. The result obtained in this work for NGC 1851 is superposed as a blue circle. The large error bar might imply that the fraction of FR-BSSs increases as a function of
values. The latter behavior might be evidence for recently formed COL-BSSs that are generated by the strong density enhancement (hence, the growth in the stellar collision probability) during core collapse. The result obtained in this work for NGC 1851 is superposed as a blue circle. The large error bar might imply that the fraction of FR-BSSs increases as a function of ![Mathematical equation: $\[A_{r h}^{+}\]$](/articles/aa/full_html/2026/01/aa57251-25/aa57251-25-eq9.png) in highly dynamically evolved systems. Despite the high value of the
in highly dynamically evolved systems. Despite the high value of the ![Mathematical equation: $\[A_{r h}^{+}\]$](/articles/aa/full_html/2026/01/aa57251-25/aa57251-25-eq10.png) parameter (
parameter (![Mathematical equation: $\[A_{r h}^{+}\]$](/articles/aa/full_html/2026/01/aa57251-25/aa57251-25-eq11.png) = 0.49, Ferraro et al. 2018), NGC 1851 is not classified as a post-core-collapse system. We thus speculate that the observed high percentage of FR-BSSs might result from a recent BSS formation due to a high rate of binary interactions, which also delay the core-collapse phase. Another possible clue of the high rate of binary interactions in NGC 1851 is suggested by the relevant number of isolated millisecond pulsars and binaries that were likely formed via exchange interactions (Ridolfi et al. 2022; Barr et al. 2024; Dutta et al. 2025).
= 0.49, Ferraro et al. 2018), NGC 1851 is not classified as a post-core-collapse system. We thus speculate that the observed high percentage of FR-BSSs might result from a recent BSS formation due to a high rate of binary interactions, which also delay the core-collapse phase. Another possible clue of the high rate of binary interactions in NGC 1851 is suggested by the relevant number of isolated millisecond pulsars and binaries that were likely formed via exchange interactions (Ridolfi et al. 2022; Barr et al. 2024; Dutta et al. 2025).
These conclusions are unfortunately quite speculative and need further observational studies of a large sample of BSSs in clusters with different characteristics. These require a high resolution and high S/N spectroscopy of relatively faint resolved stars in a highly crowded field, however, and thus represent a challenging task with the currently available instrumentation. The observed trends, especially those between the percentage of FR-BSSs and the central concentration and density of the parent cluster, nevertheless call for a renewed theoretical effort to provide a physical explanation for these observational results and to shed new light on the role of the environment and internal dynamics in setting the BSS properties.
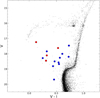 |
Fig. 5 Optical CMD of NGC 1851. The positions of fast- and slowly rotating BSSs are highlighted with red and blue circles, respectively. |
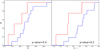 |
Fig. 6 Cumulative distributions of the V-band magnitude (left panel) and (V − I) color (right panel) for the sample of FR-BSSs (red lines) and slowly rotating BSSs (blue lines). The p-values of the Kolmogorov-Smirnov test against the null hypothesis that the two samples are extracted from the same parent distribution are marked in each panel. |
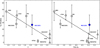 |
Fig. 7 Percentage of FR-BSSs as a function of the concentration (left panel) and the central density (right panel) of the parent cluster. The gray symbols correspond to the GCs investigated by Ferraro et al. (2023a), and the blue circle corresponds to NGC 1851. The triangles represent post-core-collapse GCs. |
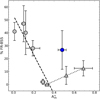 |
Fig. 8 Percentage of FR-BSSs as a function of the |
![Mathematical equation: $\[A_{r h}^{+}\]$](/articles/aa/full_html/2026/01/aa57251-25/aa57251-25-eq5.png)
Acknowledgements
This work is part of the project Cosmic-Lab (Globular Clusters as Cosmic Laboratories) at the Physics and Astronomy Department “A. Righi” of the Bologna University (http://www.cosmic-lab.eu/Cosmic-Lab/Home.html). A.B. acknowledges funding from the European Union – NextGeneration EU, Mission 4, Component 1, Investment 4.1 (D.M. 351/2022), CUP J33C22001300002. L.M. gratefully acknowledges support from ANID-FONDECYT Regular Project n. 1251809. A.M. acknowledges support from the project “LEGO – Reconstructing the building blocks of the Galaxy by chemical tagging” (PI: A. Mucciarelli) granted by the Italian MUR through contract PRIN 2022LLP8TK_001.
References
- Alessandrini, E., Lanzoni, B., Ferraro, F. R., et al. 2016, ApJ, 833, 252 [NASA ADS] [CrossRef] [Google Scholar]
- Andronov, N., Pinsonneault, M. H., & Terndrup, D. M. 2006, ApJ, 646, 1160 [Google Scholar]
- Barr, E. D., Dutta, A., Freire, P. C. C., et al. 2024, Science, 383, 275 [Google Scholar]
- Baumgardt, H., & Hilker, M. 2018, MNRAS, 478, 1520 [Google Scholar]
- Beccari, G., Ferraro, F. R., Dalessandro, E., et al. 2019, ApJ, 876, 87 [NASA ADS] [CrossRef] [Google Scholar]
- Bekki, K., & Freeman, K. C. 2003, MNRAS, 346, L11 [Google Scholar]
- Benz, W., & Hills, J. G. 1987, ApJ, 323, 614 [NASA ADS] [CrossRef] [Google Scholar]
- Billi, A., Ferraro, F. R., Mucciarelli, A., et al. 2023, ApJ, 956, 124 [NASA ADS] [CrossRef] [Google Scholar]
- Billi, A., Ferraro, F. R., Mucciarelli, A., et al. 2024, A&A, 690, A156 [NASA ADS] [CrossRef] [EDP Sciences] [Google Scholar]
- Cadelano, M., Ferraro, F. R., Dalessandro, E., et al. 2022, ApJ, 941, 69 [CrossRef] [Google Scholar]
- Castelli, F., & Kurucz, R. L. 2003, IAU Symp., 210, A20 [Google Scholar]
- Castelli, F., Gratton, R. G., & Kurucz, R. L. 1997, A&A, 318, 841 [NASA ADS] [Google Scholar]
- Clarkson, W. I., Sahu, K. C., Anderson, J., et al. 2011, ApJ, 735, 37 [NASA ADS] [CrossRef] [Google Scholar]
- Dalessandro, E., Ferraro, F. R., Massari, D., et al. 2013, ApJ, 778, 135 [NASA ADS] [CrossRef] [Google Scholar]
- Dalessandro, E., Ferraro, F. R., Bastian, N., et al. 2019, Res. Notes Am. Astron. Soc., 3, 38 [Google Scholar]
- Dattatrey, A. K., Yadav, R. K. S., Rani, S., et al. 2023, ApJ, 943, 130 [CrossRef] [Google Scholar]
- de Mink, S. E., Langer, N., Izzard, R. G., et al. 2013, ApJ, 764, 166 [NASA ADS] [CrossRef] [Google Scholar]
- Dutta, A., Freire, P. C. C., Gautam, T., et al. 2025, A&A, 697, A166 [NASA ADS] [CrossRef] [EDP Sciences] [Google Scholar]
- Ferraro, F. R., Paltrinieri, B., Fusi Pecci, F., et al. 1997, ApJ, 484, L145 [Google Scholar]
- Ferraro, F. R., Paltrinieri, B., Rood, R. T., et al. 1999, ApJ, 522, 983 [CrossRef] [Google Scholar]
- Ferraro, F. R., Sabbi, E., Gratton, R., et al. 2006, ApJ, 647, L53 [NASA ADS] [CrossRef] [Google Scholar]
- Ferraro, F. R., Beccari, G., Dalessandro, E., et al. 2009, Nature, 462, 1028 [NASA ADS] [CrossRef] [Google Scholar]
- Ferraro, F. R., Lanzoni, B., Dalessandro, E., et al. 2012, Nature, 492, 393 [Google Scholar]
- Ferraro, F. R., Lanzoni, B., Raso, S., et al. 2018, ApJ, 860, 36 [NASA ADS] [CrossRef] [Google Scholar]
- Ferraro, F. R., Mucciarelli, A., Lanzoni, B., et al. 2023a, Nat. Comm., 14, 2584 [Google Scholar]
- Ferraro, F. R., Lanzoni, B., Vesperini, E., et al. 2023b, ApJ, 950, 145 [NASA ADS] [CrossRef] [Google Scholar]
- Ferraro, F. R., Lanzoni, B., Vesperini, E., et al. 2025, arXiv e-prints [arXiv:2506.07692] [Google Scholar]
- Fiorentino, G., Lanzoni, B., Dalessandro, E., et al. 2014, ApJ, 783, 34 [NASA ADS] [CrossRef] [Google Scholar]
- Gaia Collaboration (Prusti, T., et al.) 2016, A&A, 595, A1 [NASA ADS] [CrossRef] [EDP Sciences] [Google Scholar]
- Gaia Collaboration (Vallenari, A., et al.) 2023, A&A, 674, A1 [NASA ADS] [CrossRef] [EDP Sciences] [Google Scholar]
- Geller, A. M., & Mathieu, R. D. 2011, Nature, 478, 356 [NASA ADS] [CrossRef] [Google Scholar]
- Gosnell, N. M., Mathieu, R. D., Geller, A. M., et al. 2014, ApJ, 783, L8 [Google Scholar]
- Gosnell, N. M., Mathieu, R. D., Geller, A. M., et al. 2015, ApJ, 814, 163 [Google Scholar]
- Harris, W. E. 1996, AJ, 112, 1487 [Google Scholar]
- Hills, J. G., & Day, C. A. 1976, Astrophys. Lett., 17, 87 [NASA ADS] [Google Scholar]
- Knigge, C., Leigh, N., & Sills, A. 2009, Nature, 457, 288 [NASA ADS] [CrossRef] [Google Scholar]
- Kurucz, R. 1993, Robert Kurucz CD-ROM, 13 [Google Scholar]
- Kurucz, R. L. 2005, Mem. Soc. Astron. It. Suppl., 8, 14 [Google Scholar]
- Lanzoni, B., Ferraro, F. R., Alessandrini, E., et al. 2016, ApJ, 833, L29 [NASA ADS] [CrossRef] [Google Scholar]
- Leiner, E., Mathieu, R. D., Gosnell, N. M., et al. 2018, ApJ, 869, L29 [NASA ADS] [CrossRef] [Google Scholar]
- Leonard, P. J. T., & Livio, M. 1995, ApJ, 447, L121 [NASA ADS] [CrossRef] [Google Scholar]
- Lombardi, J., Rasio, F. A., & Shapiro, S. L. 1995, ApJ, 445, L117 [NASA ADS] [CrossRef] [Google Scholar]
- Lovisi, L., Mucciarelli, A., Ferraro, F. R., et al. 2010, ApJ, 719, L121 [NASA ADS] [CrossRef] [Google Scholar]
- Lovisi, L., Mucciarelli, A., Lanzoni, B., et al. 2012, ApJ, 754, 91 [Google Scholar]
- Lovisi, L., Mucciarelli, A., Lanzoni, B., et al. 2013a, ApJ, 772, 148 [CrossRef] [Google Scholar]
- Lovisi, L., Mucciarelli, A., Dalessandro, E., et al. 2013b, ApJ, 778, 64 [NASA ADS] [CrossRef] [Google Scholar]
- Mapelli, M., Ripamonti, E., Battaglia, G., et al. 2009, MNRAS, 396, 1771 [NASA ADS] [CrossRef] [Google Scholar]
- Mathieu, R. D., & Geller, A. M. 2009, Nature, 462, 1032 [NASA ADS] [CrossRef] [Google Scholar]
- McCrea, W. H. 1964, MNRAS, 128, 147 [Google Scholar]
- Milliman, K. E., Mathieu, R. D., & Schuler, S. C. 2015, AJ, 150, 84 [CrossRef] [Google Scholar]
- Momany, Y., Held, E. V., Saviane, I., et al. 2007, A&A, 468, 973 [NASA ADS] [CrossRef] [EDP Sciences] [Google Scholar]
- Mucciarelli, A., Lovisi, L., Ferraro, F. R., et al. 2014, ApJ, 797, 43 [NASA ADS] [CrossRef] [Google Scholar]
- Nine, A. C., Mathieu, R. D., Schuler, S. C., et al. 2024, ApJ, 970, 187 [NASA ADS] [CrossRef] [Google Scholar]
- Pasquini, L., Avila, G., Blecha, A., et al. 2002, The Messenger, 110, 1 [Google Scholar]
- Perets, H. B., & Fabrycky, D. C. 2009, ApJ, 697, 1048 [Google Scholar]
- Pietrinferni, A., Hidalgo, S., Cassisi, S., et al. 2021, ApJ, 908, 102 [NASA ADS] [CrossRef] [Google Scholar]
- Portegies Zwart, S. 2019, A&A, 621, L10 [NASA ADS] [CrossRef] [EDP Sciences] [Google Scholar]
- Preston, G. W., & Sneden, C. 2000, AJ, 120, 1014 [Google Scholar]
- Rao, K. K., Bhattacharya, S., Vaidya, K., et al. 2023, MNRAS, 518, L7 [Google Scholar]
- Raso, S., Libralato, M., Bellini, A., et al. 2020, ApJ, 895, 15 [NASA ADS] [CrossRef] [Google Scholar]
- Reggiani, E., Cadelano, M., Lanzoni, B., et al. 2025, A&A, 702, A185 [NASA ADS] [CrossRef] [EDP Sciences] [Google Scholar]
- Ridolfi, A., Freire, P. C. C., Gautam, T., et al. 2022, A&A, 664, A27 [NASA ADS] [CrossRef] [EDP Sciences] [Google Scholar]
- Sahu, S., Subramaniam, A., Simunovic, M., et al. 2019, ApJ, 876, 34 [NASA ADS] [CrossRef] [Google Scholar]
- Sandage, A. R. 1953, AJ, 58, 61 [Google Scholar]
- Sarna, M. J., & De Greve, J.-P. 1996, QJRAS, 37, 11 [Google Scholar]
- Sbordone, L., Bonifacio, P., Castelli, F., et al. 2004, Mem. Soc. Astron. It. Suppl., 5, 93 [Google Scholar]
- Shara, M. M., Saffer, R. A., & Livio, M. 1997, ApJ, 489, L59 [NASA ADS] [CrossRef] [Google Scholar]
- Sills, A., Adams, T., Davies, M. B., et al. 2002, MNRAS, 332, 49 [NASA ADS] [CrossRef] [Google Scholar]
- Sills, A., Adams, T., & Davies, M. B. 2005, MNRAS, 358, 716 [NASA ADS] [CrossRef] [Google Scholar]
- Simunovic, M., Puzia, T. H., & Sills, A. 2014, ApJ, 795, L10 [NASA ADS] [CrossRef] [Google Scholar]
- Sollima, A., Lanzoni, B., Beccari, G., et al. 2008, A&A, 481, 701 [NASA ADS] [CrossRef] [EDP Sciences] [Google Scholar]
- Subramaniam, A., Sindhu, N., Tandon, S. N., et al. 2016, ApJ, 833, L27 [CrossRef] [Google Scholar]
- Stetson, P. B., Pancino, E., Zocchi, A., et al. 2019, MNRAS, 485, 3042 [NASA ADS] [CrossRef] [Google Scholar]
- Tonry, J., & Davis, M. 1979, AJ, 84, 1511 [Google Scholar]
- VandenBerg, D. A., Brogaard, K., Leaman, R., et al. 2013, ApJ, 775, 134 [NASA ADS] [CrossRef] [Google Scholar]
- Vasiliev, E., & Baumgardt, H. 2021, MNRAS, 505, 5978 [NASA ADS] [CrossRef] [Google Scholar]
- Wang, L., Jiang, D., Li, C., et al. 2025, ApJ, 984, 52 [Google Scholar]
- Xin, Y., Ferraro, F. R., Lu, P., et al. 2015, ApJ, 801, 67 [NASA ADS] [CrossRef] [Google Scholar]
Although ω Centauri is likely the remnant of a nuclear star cluster of an accreted dwarf galaxy (Bekki & Freeman 2003), the properties of its current BSS population should not depend on its true origin and can be safely compared to those of genuine GCs.
As discussed by Ferraro et al. (2023a), the 40 km s−1 threshold was chosen considering the observed rotational velocity distributions because it was noted that some clusters show a clear drop in the fraction of FR-BSSs in correspondence with this value. It was also demonstrated that a slightly different threshold (e.g., 30 or 50 km s−1) does not affect the results.
Fibre large array multi element spectrograph (FLAMES).
All Tables
All Figures
|
Fig. 1 Color-magnitude diagram of NGC 1851 (black dots). The surveyed BSSs, RGB, and HB stars are plotted as blue, red, and green circles. A set of BASTI evolutionary tracks (Pietrinferni et al. 2021) with masses ranging from 0.9 to 1.5 M⊙ is overplotted as cyan lines. A BASTI isochrone of 11 Gyr is overplotted as an orange line, and a BASTI HB model is overplotted as a green line. |
| In the text | |
|
Fig. 2 Radial velocity of the observed stars as a function of their distance from the cluster center. BSSs, RGB, and HB member stars are marked as blue, red, and green circles, respectively. The gray circles correspond to Galactic field interlopers. The dashed black line marks the average radial velocity of the member star sample. |
| In the text | |
|
Fig. 3 Comparison between the observed spectrum (black line) and the best-fit synthetic spectrum (red line) of four BSSs with different rotational velocities (see labels). |
| In the text | |
|
Fig. 4 Rotational velocity distribution of the 15 BSSs. The left arrows indicate the upper limit of 15 km s−1 adopted for very slowly rotating BSSs. |
| In the text | |
|
Fig. 5 Optical CMD of NGC 1851. The positions of fast- and slowly rotating BSSs are highlighted with red and blue circles, respectively. |
| In the text | |
|
Fig. 6 Cumulative distributions of the V-band magnitude (left panel) and (V − I) color (right panel) for the sample of FR-BSSs (red lines) and slowly rotating BSSs (blue lines). The p-values of the Kolmogorov-Smirnov test against the null hypothesis that the two samples are extracted from the same parent distribution are marked in each panel. |
| In the text | |
|
Fig. 7 Percentage of FR-BSSs as a function of the concentration (left panel) and the central density (right panel) of the parent cluster. The gray symbols correspond to the GCs investigated by Ferraro et al. (2023a), and the blue circle corresponds to NGC 1851. The triangles represent post-core-collapse GCs. |
| In the text | |
|
Fig. 8 Percentage of FR-BSSs as a function of the |
| In the text | |
Current usage metrics show cumulative count of Article Views (full-text article views including HTML views, PDF and ePub downloads, according to the available data) and Abstracts Views on Vision4Press platform.
Data correspond to usage on the plateform after 2015. The current usage metrics is available 48-96 hours after online publication and is updated daily on week days.
Initial download of the metrics may take a while.