Fig. 6
Download original image
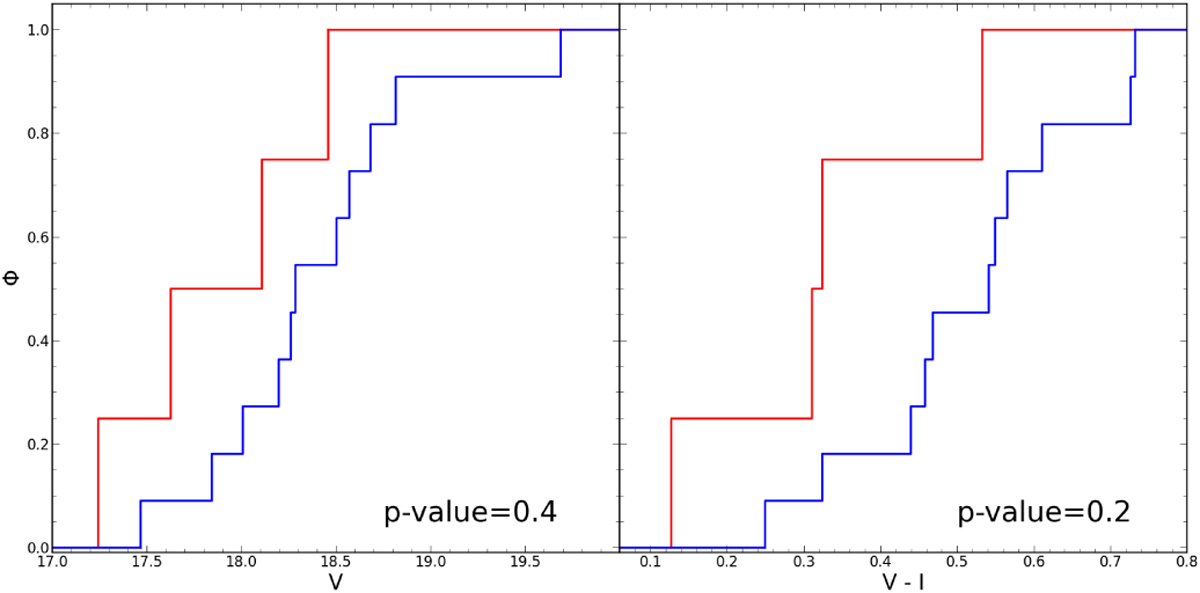
Cumulative distributions of the V-band magnitude (left panel) and (V − I) color (right panel) for the sample of FR-BSSs (red lines) and slowly rotating BSSs (blue lines). The p-values of the Kolmogorov-Smirnov test against the null hypothesis that the two samples are extracted from the same parent distribution are marked in each panel.
Current usage metrics show cumulative count of Article Views (full-text article views including HTML views, PDF and ePub downloads, according to the available data) and Abstracts Views on Vision4Press platform.
Data correspond to usage on the plateform after 2015. The current usage metrics is available 48-96 hours after online publication and is updated daily on week days.
Initial download of the metrics may take a while.