Fig. B.1.
Download original image
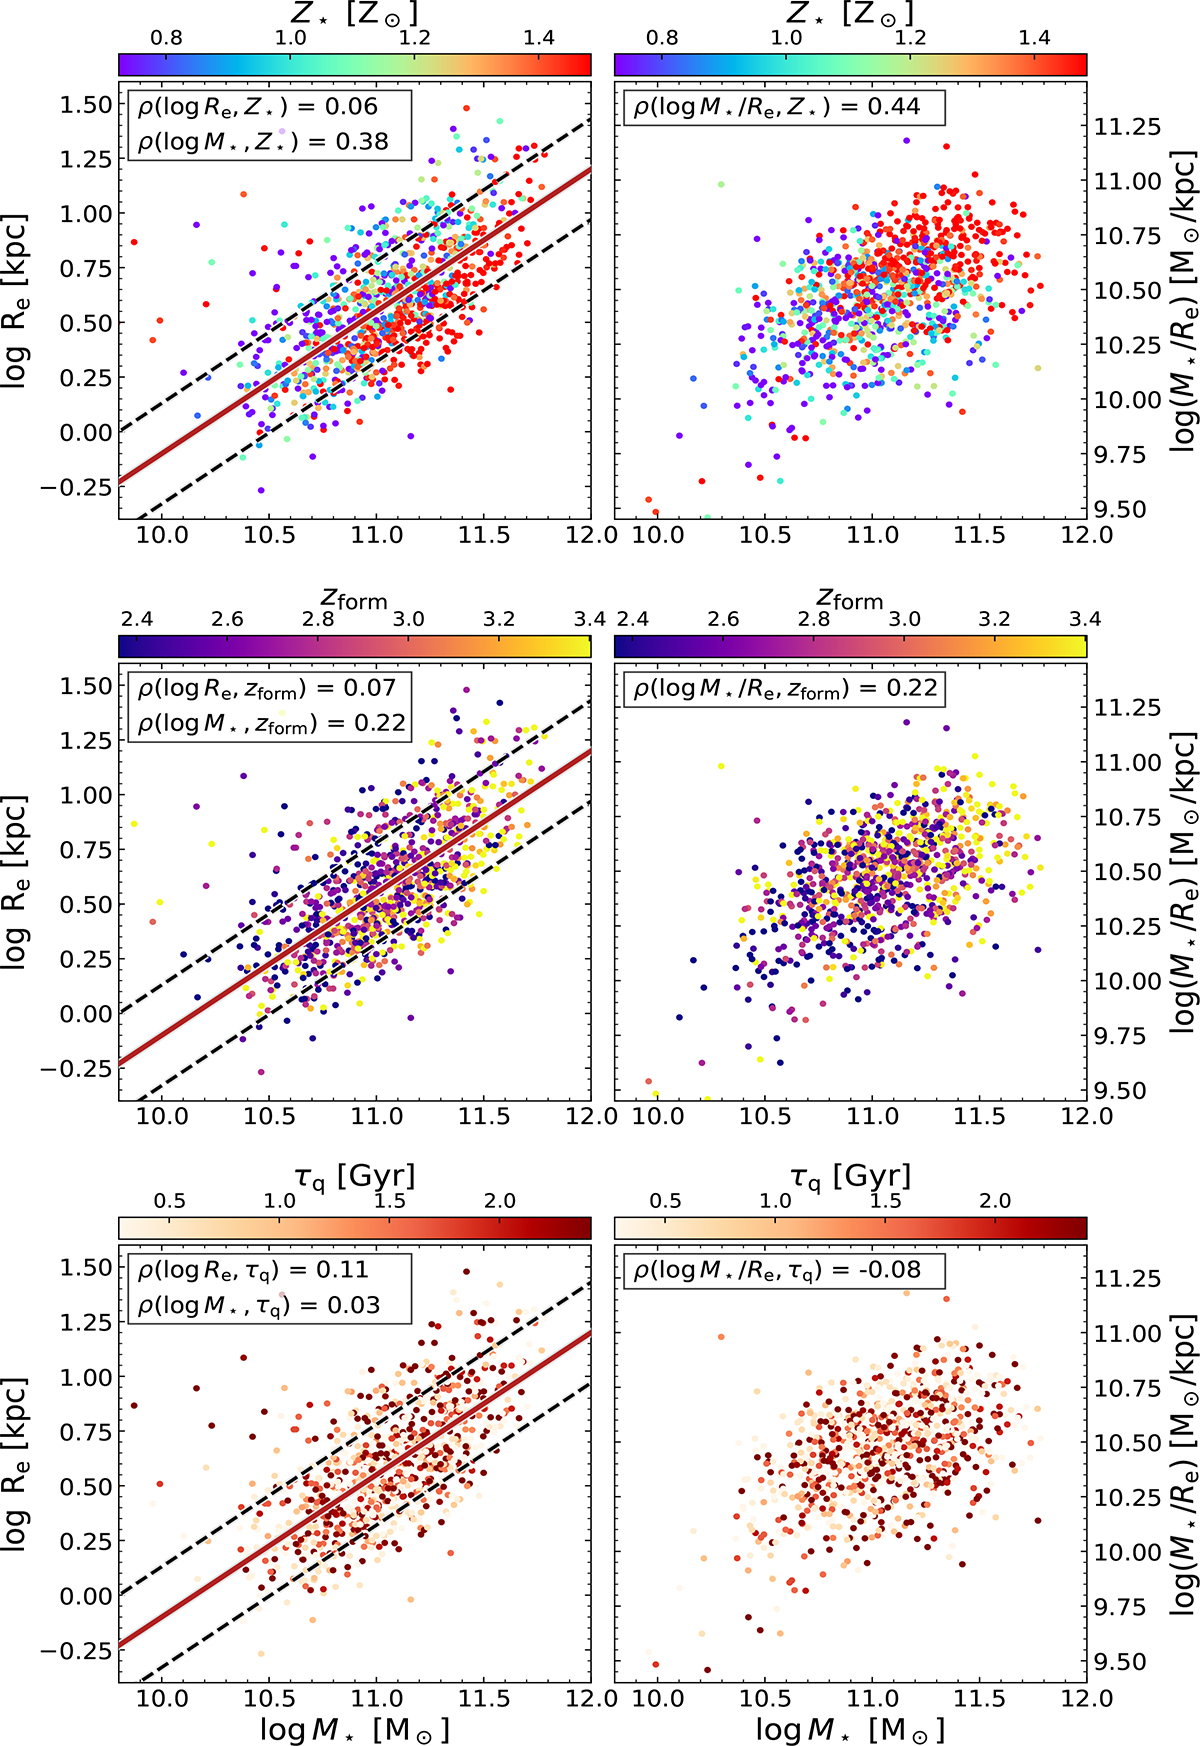
Scatter plots of the stellar population properties and quenching timescales of quiescent galaxies on the size–mass plane (left), and M★/Re vs. M★ (right). The panels from top to bottom display stellar metallicity (Z★), formation redshift (zform), and quenching timescale (τq). The solid red line is the best-fit size–mass relation for the quiescent population. The dashed black lines indicate the 1σ deviation from the best-fit relation. The stellar properties and quenching time were averaged using the LOESS method. Each hexbin contains at least five galaxies. In the top left corner of each panel we show the Spearman rank coefficients (ρ).
Current usage metrics show cumulative count of Article Views (full-text article views including HTML views, PDF and ePub downloads, according to the available data) and Abstracts Views on Vision4Press platform.
Data correspond to usage on the plateform after 2015. The current usage metrics is available 48-96 hours after online publication and is updated daily on week days.
Initial download of the metrics may take a while.