| Issue |
A&A
Volume 705, January 2026
|
|
|---|---|---|
| Article Number | A153 | |
| Number of page(s) | 15 | |
| Section | Extragalactic astronomy | |
| DOI | https://doi.org/10.1051/0004-6361/202557293 | |
| Published online | 15 January 2026 | |
The LEGA-C galaxy survey: Multiple quenching channels for quiescent galaxies at z ∼ 1
1
STAR Institute, Université de Liège, Quartier Agora Allée du six Aout 19c B-4000 Liege, Belgium
2
Sterrenkundig Observatorium Universiteit Gent Krijgslaan 281 S9 B-9000 Gent, Belgium
3
Department of Physics and Astronomy and PITT PACC, University of Pittsburgh Pittsburgh PA 15260, USA
4
Max-Planck Institut für Astronomie Königstuhl D-69117 Heidelberg, Germany
5
Institute of Astrophysics, National Taiwan University Taipei 10617, Taiwan
6
Department of Physics and Center for Theoretical Physics, National Taiwan University Taipei 10617, Taiwan
7
Physics Division, National Center for Theoretical Sciences Taipei 10617, Taiwan
8
Department of Astronomy, University of Michigan 1085 South University Avenue Ann Arbor MI 48109, USA
9
Kavli Institute for Cosmology, University of Cambridge, Madingley Road Cambridge CB3 0HA, UK
10
Cavendish Laboratory – Astrophysics Group, University of Cambridge 19 JJ Thomson Avenue Cambridge CB3 0HE, UK
11
Osservatorio Astrofisico di Arcetri Largo Enrico Fermi 5 I-50125 Firenze, Italy
12
Department of Astronomy and Astrophysics, 525 Davey Lab, The Pennsylvania State University University Park PA 16802, USA
13
Institute for Gravitation and the Cosmos, The Pennsylvania State University University Park PA 16802, USA
14
Institute for Computational and Data Sciences, The Pennsylvania State University University Park PA 16802, USA
★ Corresponding author: This email address is being protected from spambots. You need JavaScript enabled to view it.
Received:
17
September
2025
Accepted:
9
December
2025
Abstract
Aims. We analyzed the sizes and star formation histories (SFHs) of 2908 galaxies with M★ ≥ 109 M⊙ at 0.6 < z < 1.0, drawn from the Large Early Galaxy Astrophysics Census (LEGA-C) survey. The goal is to investigate the connection between galaxy sizes with SFH, stellar age, and metallicity.
Methods. The SFHs were derived with Prospector by fitting the high signal-to-noise ratio, high spectral resolution spectroscopy drawn from the LEGA-C DR3 together with the broadband photometry from the UltraVISTA catalog. The galaxy sizes were measured by fitting a 2D Sérsic profile to the HST ACS F814W images.
Results. We find diverse SFHs and quenching timescales (τq). The main quiescent population quenched over τq = 1.23 ± 0.04 Gyr, whereas the compact post-starburst galaxies (PSBs) quenched much faster, τq = 0.13 ± 0.03 Gyr. At fixed stellar mass, smaller quiescent galaxies quenched more rapidly than larger ones; at fixed size, the dependence on stellar mass is weak. Larger quiescent galaxies are marginally younger, quenched more slowly, and have near-solar metallicities, while compact quiescent galaxies are older, metal-rich, and quenched faster. PSBs formed half their mass later (zform ∼ 1.9) and quenched on the shortest timescales. The general trends with galaxy size, Z★, and zform for the quiescent populations remain consistent regardless of the method used to derive the stellar properties.
Conclusions. We conclude that compact quiescent galaxies are consistent with both early moderately fast quenching and with more rapid late quenching. While this may suggest the existence of multiple quenching channels, our data are also compatible with a continuous distribution of quenching timescales. These findings suggest that different physical mechanisms may drive quenching across galaxy populations, potentially leading to similar morphological outcomes despite the differing evolutionary histories.
Key words: galaxies: evolution / galaxies: fundamental parameters / galaxies: high-redshift / galaxies: statistics
© The Authors 2026
 Open Access article, published by EDP Sciences, under the terms of the Creative Commons Attribution License (https://creativecommons.org/licenses/by/4.0), which permits unrestricted use, distribution, and reproduction in any medium, provided the original work is properly cited.
This article is published in open access under the Subscribe to Open model. This email address is being protected from spambots. You need JavaScript enabled to view it. to support open access publication.
1. Introduction
Galaxies exhibit a large diversity in morphology, chemical composition, and star formation histories (SFHs), reflecting the multitude of evolutionary pathways they can follow. A key question in galaxy evolution is understanding the processes that drive the cessation of star formation, commonly referred to as quenching. Quenching in massive galaxies is thought to result from a combination of mechanisms, including the depletion of cold gas reservoirs (Springel et al. 2005; Zhang et al. 2019), virial shock heating in massive halos (Birnboim & Dekel 2003; Birnboim et al. 2007; Kereš et al. 2005; Dekel & Birnboim 2006; Mitra et al. 2015), and feedback processes such as supernova explosions or active galactic nucleus (AGN) activity that inhibit gas cooling (e.g., Crenshaw et al. 2003; Best et al. 2005; Croton et al. 2006; Fabian 2012; Cheung et al. 2016; Harrison 2017; Barišić et al. 2017; Terrazas et al. 2017; Henden et al. 2018; Semenov et al. 2021; Dome et al. 2024). The efficiency of these mechanisms varies with galaxy mass, morphology, and environment, and creates a complex interplay that shapes galaxy properties over time.
One aspect of this complexity is the relationship between galaxy sizes, SFHs, and stellar population properties. Observations show that quiescent galaxies in the local Universe are typically smaller than star-forming galaxies of the same stellar mass, and follow steeper size–mass relations (Shen et al. 2003). This correlation is further complicated by evidence that the quenching process itself can modify galaxy structure (McDermid et al. 2015; Wu et al. 2018a; Hamadouche et al. 2022). For example, energy injection from feedback mechanisms can suppress star formation without drastically altering stellar distributions (Dekel & Birnboim 2006; Fabian 2012; Terrazas et al. 2017), whereas rapid quenching due to starbursts, gas-rich galaxy mergers, or disk instabilities can lead to galaxies with dense stellar cores (Springel et al. 2005; Snyder et al. 2011; Zolotov et al. 2015; Tacchella et al. 2016; van der Wel & Meidt 2025). These processes imprint signatures of quenching events onto galaxy morphologies, making structural properties a valuable tracer of galaxy evolution.
Evidence from large extragalactic surveys as well as hydrodynamical simulations further supports differences in galaxy structure as a function of star formation. Studies in the local Universe show evidence of compact galaxies quenching faster than galaxies with an extended stellar disk (e.g., McDermid et al. 2015; Barone et al. 2020). Conversely, massive galaxies with an extended disk build up their stellar content slowly over a longer timescale (Boissier et al. 2016; Zhu et al. 2018). Cosmological simulations also indicate that galaxies with extended stellar disks tend to quench more slowly compared to their compact counterparts (Pillepich et al. 2018; Tacchella et al. 2019; Gupta et al. 2021; Park et al. 2022).
Consequently, the connection between galaxy sizes and stellar population properties offers a unique insight into quenching pathways. At fixed stellar mass, larger quiescent galaxies tend to have younger stellar populations in their outskirts, consistent with size growth through processes, for example minor mergers (Shankar et al. 2010; Carollo et al. 2013). Conversely, compact quiescent galaxies appear to quench earlier, resulting in older stellar populations (Fagioli et al. 2016; van der Wel et al. 2014; Carnall et al. 2023a). Recent studies also suggest two distinct quenching pathways: (i) fast quenching associated with starbursts, which produces compact post-starburst galaxies, and (ii) slow quenching, which allows extended disks to persist, resulting in younger stellar populations (e.g., Yano et al. 2016; Almaini et al. 2017; Maltby et al. 2018; Wu et al. 2018a; Suess et al. 2020; Setton et al. 2022; Zhang et al. 2024). Hints of a connection between compactness with a recent burst of star formation has been reported for massive galaxies at even higher redshifts (e.g., z ∼ 1.5 Keating et al. 2015; Jain et al. 2024; z ∼ 2.5–3 Barro et al. 2017). Despite these observations, the causality behind these empirical relations, as well as the basic link between SFHs, quenching mechanisms, and galaxy sizes remains difficult to establish (Lilly & Carollo 2016).
To address these questions, we adopted an “archeological” approach to trace the evolution of galaxies over time, examining how their SFHs vary with stellar mass and morphology. This study builds upon the work of Wu et al. (2018b), who analyzed the evolutionary pathways of a subsample of quiescent galaxies from the Large Early Galaxy Astrophysics Census (LEGA-C; van der Wel et al. 2016, 2021) DR2, using stellar age indicators such as DN4000 and Hδ. Here we investigate the relationship between galaxy sizes, SFHs, quenching times, and stellar population properties by leveraging spectrophotometric modeling results from Prospector (Leja et al. 2017; Johnson et al. 2021) and the LEGA-C DR3 dataset (Nersesian et al. 2025). By studying both the structural and stellar population properties of galaxies, we aim to determine whether there is a link between galaxy sizes, SFHs, and quenching times.
For this analysis, we used a sample of 2908 galaxies from the LEGA-C DR3 survey, which provides high signal-to-noise ratio, high-resolution spectra of galaxies at redshifts 0.6 ≤ z ≤ 1. These spectra enable precise measurements of stellar ages and SFHs (Chauke et al. 2018; Wu et al. 2018b; Barone et al. 2022; Kaushal et al. 2024; Nersesian et al. 2024, 2025; Gallazzi et al. 2025a,b), while imaging from the Hubble Space Telescope (HST) enables accurate size measurements. By linking galaxy structure, quenching mechanisms, and stellar population properties, this study contributes to a broader effort to understand the physical processes driving galaxy evolution.
2. Data, sample, and analysis
2.1. The LEGA-C survey
LEGA-C is a Ks-band magnitude selected spectroscopic survey, that obtained 4081 high S/N rest-frame optical spectra at a lookback time of ∼7 Gyr (van der Wel et al. 2016, 2021). A LEGA-C spectrum has a typical observed wavelength range of 6300 Å < λ < 8800 Å or ∼3000 Å < λ < 5550 Å in restframe. The spectra belong to 3741 unique galaxy targets, with 340 spectra being duplicate observations that cover a slightly different spectral range. Each galaxy received ∼20 h of integration time at the 8 m Very Large Telescope (VLT), with an effective spectral resolution of R ∼ 3500. We refer to van der Wel et al. (2016, 2021) and Straatman et al. (2018) for more details about the goals, design, and data reduction of the LEGA-C survey.
2.2. SED fitting with Prospector
In Nersesian et al. (2025), we derived the physical properties (i.e., stellar mass, SFR, stellar ages, and stellar metallicity) and SFHs of the LEGA-C galaxies, by fitting a subset of photometric bands from the UltraVISTA catalog (Muzzin et al. 2013b,a) together with the LEGA-C spectra. Only a subset of eight broadbands from the UltraVISTA catalog was used (B, V, r+, i+, z+, Y, J and MIPS 24 μm). Then, the Prospector1 inference framework (Leja et al. 2017; Johnson et al. 2021) was applied to fit the broadband photometry and the LEGA-C spectroscopy, with a flexible spectrophotometric calibration. A physical model of 20 free parameters was generated that combined stellar, nebular, and dust models into composite stellar populations. The default SPS parameters in FSPS were adopted (i.e., the MILES stellar library, Sánchez-Blázquez et al. 2006; and the MIST isochrones, Choi et al. 2016), and a Chabrier (2003) initial mass function (IMF).
One of the particular advantages of Prospector is the availability of nonparametric SFHs with various prior distributions and parameterizations. The benefit of using a nonparametric SFH is that we do not have to impose a particular function for the shape of the SFH. It has also been shown that a nonparametric SFH can outperform the traditional parametric SFH by vastly improving the stellar mass estimates (Lower et al. 2020). In this work we use the continuity SFH with a Student’s-t prior distribution (Leja et al. 2019a). The continuity prior favors a piecewise constant SFH with smooth transitions in SFR(t). To define the nonparametric SFH, we used eight time bins as free parameters, specified in lookback time. The first two time bins were fixed at 0–30 Myr and 30–100 Myr to capture any recent variations in the SFH. For the full description of the SED modeling with Prospector and a presentation of the various quality tests of the fits, we refer to Nersesian et al. (2025).
2.3. Primary galaxy sample
In this paper, we used the same sample of 2908 galaxies presented in Nersesian et al. (2025). The sample was selected to be all galaxies that have a PRIMARY flag equal to one, indicating that a galaxy was chosen from the Ks-band selected parent sample (van der Wel et al. 2021). The redshift range of our sample is 0.6 ≤ z ≤ 1, with a median redshift  , and an average S/N of ∼17.2 Å−1 for the continuum. This sample is characterized by a median stellar velocity dispersion
  , a median stellar mass of
  , and a median SFR over the last 100 Myr log ⟨SFR100Myr/
 . The subscripts and superscripts indicate the 16th–84th percentile ranges.
The completeness of the LEGA-C spectroscopic sample is well understood thanks to its Ks-band selection and high measurement success rate (see Appendix A of van der Wel et al. 2021). This translates into a representative sampling of the 0.6 < z < 1.0 galaxy population, for which the completeness depends only on redshift and Ks-band magnitude, and no other galaxy property.
Figure 1 shows the relationship between SFR100Myr and M★, otherwise known as the star-forming sequence (SFS; Strateva et al. 2001; Baldry et al. 2004; Daddi et al. 2007; Noeske et al. 2007; Elbaz et al. 2007; Whitaker et al. 2012). Galaxies can be separated into two broad galaxy populations, quiescent and star-forming. It has been shown that the normalization of the SFS evolves with redshift (e.g., Whitaker et al. 2012; Fumagalli et al. 2014; Speagle et al. 2014; Daddi et al. 2022; Leja et al. 2022; Popesso et al. 2023; Koprowski et al. 2024). In this work, we used the definition of SFS ridge at z = 0.6 from Leja et al. (2022). We find a rather flat relation between SFR and stellar mass for the star-forming galaxies. A number of recent studies have also observed the flattening of the SFS for massive galaxies (M★ > 1010 M⊙) (e.g., Lee et al. 2015; Schreiber et al. 2016; Leslie et al. 2020; Daddi et al. 2022; Leja et al. 2022; Popesso et al. 2023). However, the cause remains debated, with proposed explanations including reduced star formation efficiency (e.g., Schreiber et al. 2016), a decline in available cold molecular gas (e.g., Daddi et al. 2022; Popesso et al. 2023), or the result of mergers rather than ongoing star formation (e.g., Fu et al. 2024). Quiescent galaxies show a stronger correlation with stellar mass, forming their own red sequence. At fixed mass, quiescent galaxies at intermediate redshift are characterized by an older stellar population, high metallicity, and a more concentrated light profile than star-forming galaxies (e.g., Beverage et al. 2021; Cappellari 2023; Martorano et al. 2025; Nersesian et al. 2025; Gallazzi et al. 2025b).
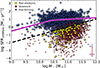 |
Fig. 1. SFR100Myr as a function of M★ for the LEGA-C galaxies at 0.6 ≤ zspec ≤ 1. Galaxies are color-coded by their UVJ diagram classification as UVJ star-forming (blue stars) and UVJ quiescent (red points) populations. Post-starburst galaxies are indicated as yellow squares. The magenta line indicates the SFS at z = 0.6 from Leja et al. (2022), and the dashed black line indicates the separation between star formation and quiescence (sSFR = 10−11 yr−1). The average uncertainties for the two main galaxy populations are shown in the bottom right corner in their respective colors. |
Different criteria are usually employed to classify galaxies as quiescent. The two most common criteria to separate galaxies are based on (i) their locus on the UVJ diagram (Labbé et al. 2005; Wuyts et al. 2007; Williams et al. 2009), and (ii) their specific star formation rate (sSFR = SFR100Myrs/M★). Using the definition of Muzzin et al. (2013a) for quiescence in the UVJ diagram, we find 1208 quiescent and 1700 star-forming galaxies. Alternatively, quiescence can be defined based on the sSFR of galaxies. The sSFR can be seen as a measure of the current to past star formation in galaxies, tracing the hardness of the UV radiation field (Ciesla et al. 2014). Many studies suggest a threshold at logsSFR/yr−1 ≈ −10 (e.g., Whitaker et al. 2017; Wu et al. 2018a; Leja et al. 2019c), while others propose a slightly lower boundary at logsSFR/yr−1 ≈ −10.55 (e.g., Gallazzi et al. 2014). In this study, we adopt a threshold of logsSFR/yr−1 ≤ −11 (i.e., Brinchmann et al. 2004; Fontanot et al. 2009; Cecchi et al. 2019; Donnari et al. 2019; Paspaliaris et al. 2023; Nersesian et al. 2025), which aligns best with the UVJ quiescence criteria, yielding 1240 quiescent and 1668 star-forming galaxies in our sample.
In Fig. 1, galaxies are color-coded by their UVJ diagram classification as star-forming (blue stars) and quiescent (red points). It is clear from Fig. 1 that the UVJ criterion for quiescence largely follows the sSFR criterion, albeit with 7% of UVJ-quiescent galaxies showing signs of star formation (sSFR ≥ 10−11 yr−1). Furthermore, a UVJ quiescent selection can yield a 10%–30% contamination from star-forming galaxies (Moresco et al. 2013; Belli et al. 2017; Fang et al. 2018; Merlin et al. 2018; Schreiber et al. 2018; Leja et al. 2019c). These contamination fractions are indicative of the slight challenge of defining quiescence. When necessary, we divided the sample into star-forming and quiescent galaxies based on the sSFR criterion as a more robust method to determine quiescence. The results and conclusions of this paper are not affected by the definition of quiescence, since the demographics we obtain from the two quiescence criteria are quite similar.
2.4. Post-starburst galaxies
Post-starburst galaxies (PSBs) are interesting objects to study as they can hint at the different pathways that galaxies follow towards quiescence (e.g., Wu et al. 2018a). The spectrum of a PSB galaxy is characterized by prominent Balmer absorption lines, indicative of an abundance of A-type stars (Dressler & Gunn 1983; Balogh et al. 1999; Dressler et al. 1999), and very weak nebular emission, indicative of the absence of O- and B-type stars. The spectroscopic information of PSBs suggest a quenching event that occurred in a relatively short timescale (typically less than 1 Gyr) after a burst of star formation.
Similar to the studies of Wu et al. (2018a, 2020a), we selected the PSBs in the quiescent galaxy population based upon their HδA absorption strength (Gallazzi et al. 2025a). In particular, we required quiescent galaxies to have a HδA ≥ 4 Å. If we apply this criterion we end up with 84 PSB galaxies in our sample, with a median value of HδA = 5.42 Å. PSBs are marked as yellow squares in Fig. 1. The fraction of PSBs among the quiescent galaxy population is ∼7%, and is in agreement with PSB fractions found in previous studies (e.g., Poggianti et al. 2009; Gallazzi et al. 2014; Wu et al. 2020a). It is important to note that the PSB sample reflects a selection based on spectral features, rather than necessarily representing a physically distinct class of galaxies.
2.5. The size–mass relation
Figure 2 shows the relation between galaxy size and stellar mass. Wu et al. (2018a) measured the galaxy sizes by fitting a 2D Sérsic (1963) profile to the HST ACS F814W images from COSMOS (Scoville et al. 2007). In particular, a 10″ cutout for each galaxy was created and then fitted with galfit (Peng et al. 2010), using a single Sérsic profile with 6 free parameters (Sérsic index, effective radius, total magnitude, axis ratio, position angle, and background). The effective radius (Re) is the semimajor axis of the ellipse that contains half of the total flux of the best-fit Sérsic model. Out of the 2908 galaxies, only 2744 have a size measurement, of which 1577 are star-forming galaxies and 1167 quiescent.
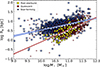 |
Fig. 2. Galaxy size as a function of M★ for the LEGA-C galaxies at 0.6 ≤ zspec ≤ 1. Based on their sSFR, galaxies are separated into star-forming (blue stars) and quiescent (red points) populations. Post-starburst galaxies are indicated as yellow squares. For each galaxy population, we fitted a linear relation between the median sizes in each 0.1 dex mass bin and the stellar mass (gray symbols). To avoid the flattening of the relations at the low-mass end, we fit star-forming galaxies with log(M★/M⊙) ≥ 9.8 and quiescent galaxies with log(M★/M⊙) ≥ 10.3. |
To derive the size–mass relation for our LEGA-C primary sample, we followed the approach of Wu et al. (2018a) and fitted a linear relation between the median sizes and the stellar mass in each 0.1 dex mass bin, in log–log space. We restrict the range of masses that are fitted to the high-mass regime in order to exclude the low-mass range where the mass-size relations are known to flatten (e.g., Graham 2013; Cappellari et al. 2013; Shankar et al. 2014; Norris et al. 2014; van der Wel et al. 2014; Lange et al. 2015; Furlong et al. 2017; Whitaker et al. 2017; Martorano et al. 2024). The following functional form was used:
![Mathematical equation: $$ \begin{aligned} \log \left(R_\mathrm{e} / \mathrm{kpc} \right)_\mathrm{med} = \alpha \times \left[\log \left(M_\star / \mathrm{M} _\odot \right) - 11 \right] + \beta . \end{aligned} $$](/articles/aa/full_html/2026/01/aa57293-25/aa57293-25-eq5.gif) (1)
(1)
Here (α, β) are the best-fit slope and intercept respectively. We estimated the median and 1–σ range of these two free parameters using a bootstrap resampling (1000 iterations), considering the uncertainties on M★. For the star-forming galaxies, we find a relation with a median slope of α = 0.32 ± 0.04 and a median intercept of β = 0.84 ± 0.02. For the quiescent galaxies, we measure a much steeper slope with α = 0.65 ± 0.02 and β = 0.55 ± 0.01. Our measured slopes are in good agreement with those derived for late- and early-type galaxies at comparable redshift (z ≃ 0.75) in the CANDELS survey (0.22 ± 0.01, and 0.71 ± 0.01 respectively van der Wel et al. 2014). The best-fit relations are shown in Fig. 2 with the blue (star-forming galaxies) and red (quiescent galaxies) lines.
For completeness, we also fit the size–mass relation for the full sample. Again, to avoid the flattening of the relation at the low-mass end, we fit only those galaxies with log(M★/M⊙) ≥ 10.3. We find a relation with a median slope of α = 0.31 ± 0.01 and a median intercept of β = 0.73 ± 0.01. All three best-fit lines of the size–mass relation are summarized in Table 1.
To quantify the galaxy sizes within each population, we calculated the distance of the sizes Re from the median size–mass relation of its respective population at a given stellar mass, according to Equation (1). This was computed using the following function:
 (2)
(2)
Figure 3 shows the distributions of Δlog(Re) for both the star-forming and quiescent galaxies. Both distributions are centered very close to zero with a small offset of μ = −0.02 dex for the star-forming galaxies. We also measure a similar standard deviation (σ) of 0.23 dex for both galaxy populations. The standard deviation in this work is consistent with the observed scatter expected at an average redshift of 0.75 (see Fig. 6 from van der Wel et al. 2014).
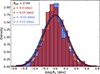 |
Fig. 3. Distribution of the galaxy size metric Δlog(Re), defined as the distance of the sizes Re from the median size–mass relation at a given mass, for each galaxy population. The blue histogram shows the relative size distribution for the star-forming galaxies, while the red histogram shows the relative size distribution for the quiescent galaxies. The corresponding solid curves are the best-fit Gaussian distributions. The statistics of the mean offset (μ) and variance (σ) of each Gaussian distribution is shown at the top left. |
3. The SFHs of the LEGA-C galaxy sample
The SFHs of LEGA-C galaxies is a topic that has been explored in the past. A first reconstruction of SFHs for a small subsample of DR2 LEGA-C galaxies was performed by Chauke et al. (2018). A more comprehensive study on the SFHs of DR3 LEGA-C galaxies was recently performed by Kaushal et al. (2024). The authors conducted a spectrophotometric analysis using BAGPIPES and assuming a parametric double-power law SFH. Their goal was to quantify the timescales of stellar mass formation. Kaushal et al. (2024) also performed a comparison between their SFHs and the nonparametric SFHs recovered with Prospector (Nersesian et al. 2025). Their analysis yielded consistent late-time SFRs for star-forming and quiescent galaxies, despite the differences in the modeling methods (parametric vs. nonparametric). Here, we give a brief overview of the nonparametric SFHs of the LEGA-C survey as retrieved with Prospector for the primary galaxy sample (2908 galaxies), and compare our results with other observations at higher zobs. For a more detailed analysis and discussion on the SFHs of the LEGA-C sample and the formation times, we refer to Kaushal et al. (2024, see also recent study by Wan et al. 2025).
3.1. The variety of SFHs
We defined the SFHs using the sSFR(t) instead of SFR(t), because the sSFR is a better indicator of quiescence (Whitaker et al. 2017), with its inverse tracing the formation timescale of a galaxy’s stellar population. The sSFR(t) is simply defined as the fitted SFR of each time bin in our physical model, normalized by the total stellar mass formed up to that time bin (sSFR(t) = SFR(t)/Mformed). Then, we interpolated all SFHs in our primary sample on a uniform age grid from 0.01–7 Gyr, and smoothed using a Box1DKernel with a smoothing factor of 10 Myr (see Kaushal et al. 2024). In Fig. 4, we plot the individual SFHs of our primary sample, as well as the median trends for the three galaxy populations: the star-forming (solid blue line), the quiescent (solid red line), and the PSBs (dashed yellow line)2. We also plot the transition boundary (green region) from star-forming (sSFR = 1/[3 tH(z)]) to quiescence (sSFR = 1/[20 tH(z)]), as defined by Tacchella et al. (2022) (see also Pacifici et al. 2016), where tH(z) is the Hubble time at a median redshift z = 0.76. We define the quenching timescale (τq) as the time a galaxy takes to transition from star-forming to quiescent.
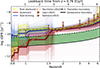 |
Fig. 4. Nonparametric SFHs of LEGA-C galaxies recovered with Prospector. The fitted SFR of each time bin is normalized by the total stellar mass formed up to that time bin. The SFHs are divided into the star-forming (blue) and quiescent (red) populations, based on their sSFR. In the background, we show the individual SFHs of our sample, while the thick lines and shaded areas denote the median and the 16th–84th percentile range for the star-forming (solid blue line and shaded blue area), quiescent (solid red line and shaded red area; excluding the 84 PSBs), and PSB (dashed yellow line and shaded yellow area) galaxies. The green shaded area displays the transition boundary from star-forming (dashed black line) to quiescence (solid black line). The coral point and square markers show the measurements of sSFR by Salmon et al. (2015) and Leja et al. (2022), respectively, at higher redshift. The dashed coral line shows the SFHs of lower-mass quiescent galaxies (10.5 ≤ log(M★/M⊙) < 11) from Tacchella et al. (2022). |
Looking at the individual SFHs, the LEGA-C galaxies have a large range of SFHs, spanning five orders of magnitude in sSFR. The τq depends on the precise definition of the boundary region; we address this caveat in Sect. 5 and Appendix A. Moreover, the apparent sharp changes in sSFR at specific lookback times (e.g., 0.5, 1.1, 2.8 Gyr) reflect artifacts introduced by the binning scheme rather than physical events across the galaxy population. While the overall trends in quenching timescales are robust, the precise values of τq should be interpreted with caution.
The large diversity of pathways towards quiescence is evident from the 16th–84th percentile range of the red galaxies. Looking at the individual SFHs of red galaxies, we notice that galaxies can reach quiescence quite early (within the first 2 Gyr after the Big Bang) or at a later epoch, with different quenching timescales.
The median trends in Fig. 4 suggest that within the first 4 Gyr after the Big Bang the reconstructed SFHs of quiescent and star-forming galaxies are broadly similar. However, the constraints at high z (z > 3) are weak and largely shaped by the modeling assumptions rather than direct information in the data. In this regime, our median SFHs fall systematically below the photometry-based sSFR measurements of Salmon et al. (2015). This qualitative comparison should not be interpreted as a direct tension between equally robust measurements, as the underlying methods and data differ. Nevertheless, our results are still consistent with Salmon et al. (2015) within the 16th–84th percentile range. At lower redshift (z < 3), the median SFH of the star-forming galaxies (solid blue line) agrees very well with the sSFR measurements of Leja et al. (2022). Likewise, the median SFH of the quiescent population (solid red line) closely follows that of lower-mass quiescent galaxies (10.5 ≤ log(M★/M⊙) < 11) from Tacchella et al. (2022). Based on these median SFH trends, we infer that quiescent galaxies at 0.6 ≤ z ≤ 1 began to diverge from the star-forming population around z ≈ 1.5, entering a transition phase toward quiescence with a broad range of quenching timescales. In contrast, the median SFH of PSB galaxies shows a distinctly different pattern, maintaining high SFRs until undergoing a sudden and rapid quenching episode. We emphasize, however, that this behavior is partly a consequence of our spectroscopic PSB selection, which preferentially identifies galaxies with recent, rapid transitions. Similar fast-quenching events may also have occurred in galaxies now classified as quiescent, but they are more difficult to identify at earlier epochs.
From the individual SFHs of the quiescent population, we calculated the median quenching timescale obtaining ⟨τq⟩ = 1.23 ± 0.04 Gyr (16th–84th percentile range: 0.33–2.4 Gyr) for the quiescent galaxies, and ⟨τq⟩ = 0.13 ± 0.03 Gyr (16th–84th percentile range: 0.01–0.47 Gyr) for the PSBs. The uncertainties represent the statistical uncertainty on the median ( ), while the 16th–84th range reflects the intrinsic spread among galaxies. Notably, many quiescent galaxies also exhibit relatively short τq indicating a diversity of quenching pathways.
3.2. SFHs as a function of M★
In order to assess whether galaxies of different mass follow different evolutionary trajectories, we binned their SFHs into three stellar mass bins, and calculated the median SFH in each bin. In Fig. 5, we present the median SFHs as a function of stellar mass for the full sample, star-forming, and quiescent galaxies. The median SFHs of the full sample indicate that galaxies with varying stellar masses exhibit distinct sSFRs from an early stage (within the first ∼1.5 Gyr after the Big Bang). In particular, higher-mass galaxies seem to form stars faster than the less massive galaxies. From ∼2 to 4 Gyr after the Big Bang, we see a decline in star formation with time, with all galaxies having very similar sSFRs. At z ∼ 1.5, we observe that the most massive galaxies begin to transition from star formation to quiescence. Our results support the downsizing scenario, stating that the highest SFR occurs in progressively less massive galaxies with decreasing redshift (Cowie & Barger 2008), and thus more massive galaxies contain older stellar populations, consistent with previous studies on this topic (e.g., Fontanot et al. 2009; Tojeiro et al. 2009; McDermid et al. 2015; Ibarra-Medel et al. 2016; Pacifici et al. 2016; Chauke et al. 2018; Tacchella et al. 2022; Kaushal et al. 2024; Gallazzi et al. 2005, 2014). Analyzing the SFHs of the star-forming galaxies reveals that more massive galaxies began transitioning toward quiescence at z ∼ 1 and remain in this phase, while less massive galaxies continue forming stars, albeit at a slower rate. Additionally, the median SFHs for galaxies in the intermediate stellar mass bin (10.5 ≤ log(M★/M⊙) < 11) align perfectly with the median SFH reported for the same mass bin in Tacchella et al. (2022). Quiescent galaxies display a weaker dependence on M★, with the transition to quiescence occurring at approximately the same epoch (z ∼ 1.5). Based on the median SFHs, we find a weak correlation between stellar mass and quenching time, with an average quiescence transition duration of τq ≈ 1.2 Gyr. These findings are consistent with the quiescence times reported by both Kaushal et al. (2024) and Tacchella et al. (2022). This agreement is particularly reassuring, as Kaushal et al. (2024) analyzed the same LEGA-C dataset but applied a different fitting method (i.e., BAGPIPES), whereas Tacchella et al. (2022) utilized the same fitting method (i.e., Prospector) but analyzed a different dataset (HALO7D program, a survey conducted in CANDELS fields Grogin et al. 2011; Koekemoer et al. 2011).
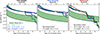 |
Fig. 5. Median SFHs of LEGA-C galaxies separated into three stellar mass bins. From left to right: Median SFHs of the full primary galaxy sample, the star-forming population, and the quiescent population. The dotted violet line in the star-forming galaxies panel shows the SFH of high-mass star-forming galaxies from Tacchella et al. (2022). The dashed and dotted coral lines in the quiescent galaxies panel show the SFHs of lower-mass and higher-mass quiescent galaxies from Tacchella et al. (2022), respectively. The green shaded area displays the transition boundary from star-forming (dashed black line) to quiescence (solid black line). |
3.3. Dependence of SFHs on galaxy size
To explore the connection between galaxy size and SFHs, we estimated the median SFHs of LEGA-C galaxies, dividing them into three stellar mass bins and three size bins, as parameterized by the relative size metric Δlog(Re). Specifically, Δlog(Re) for each galaxy population was determined based on their corresponding size–mass relation (see Table 1 for definitions). The solid lines in Fig. 6 represent the median SFH trends for star-forming (blue) and quiescent (red; including the 84 PSBs) galaxies, while the corresponding shaded regions denote the 16th–84th percentile range.
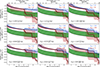 |
Fig. 6. Median SFHs of LEGA-C galaxies separated into three stellar mass and three galaxy size bins: Δlog(Re)≤ − 0.23, −0.23 < Δlog(Re) < 0.23, and Δlog(Re)≥0.23. The SFHs are divided into the star-forming (blue) and quiescent (red) populations, based on their sSFR. The corresponding shaded regions denote the 16th–84th percentile range. The green shaded area displays the transition boundary from star-forming (dashed black line) to quiescence (solid black line). In the bottom left corner of each panel, we report the median ⟨τq⟩ from the individual SFHs in each bin (shown in black), along with the corresponding 16th–84th percentile range. |
Examining the median SFHs of star-forming galaxies, we find that at a fixed size, the most massive galaxies cross the transition boundary (dashed black line) earlier than lower-mass galaxies. This observation aligns with the downsizing scenario, where more massive galaxies tend to quench earlier. At a fixed mass, we do not find strong evidence of a correlation between Δlog(Re) and the average sSFR computed over the last 100 Myr. That said, there is a very subtle indication that at fixed mass larger galaxies (Δlog(Re) > 0.23 dex) sustain star formation for a longer duration compared to their smaller counterparts (Δlog(Re)≤ − 0.23 dex).
In contrast, for quiescent galaxies at a fixed mass, we observe a positive correlation between quenching timescale and Δlog(Re). Specifically, larger quiescent galaxies exhibit longer quenching timescales than smaller ones. For example, among intermediate-mass quiescent galaxies, the median quenching timescale for galaxies 1σ below the size–mass relation is ⟨τq⟩ = 0.52 Gyr, whereas larger galaxies in the same mass range quench approximately 0.7 Gyr more slowly (⟨τq⟩ = 1.2 Gyr). At a fixed size, we also find tentative evidence that more massive galaxies quench at a slower rate.
4. Galaxy quenching and the size–mass plane
Exploring the relationship between the size, stellar age, stellar metallicity, and quenching timescale could shed more light on the various evolutionary paths that galaxies follow, and possibly explain the observed scatter on the size–mass plane. The left column of Fig. 7 shows the average trends in stellar metallicity (Z★), formation redshift (zform)3, and quenching timescale (τq) of the quiescent galaxy population on the size–mass plane. The quenching timescales were calculated from the individual SFHs of the quiescent and PSB galaxies. The average trends were derived with the Locally Weighted Regression (LOESS) method (Cleveland & Devlin 1988) as implemented in the LOESS routine4 by Cappellari et al. (2013). In particular, we used a linear local approximation, a smoothing factor of f = 0.3, and required that each hexbin contains at least five galaxies. The right column of Fig. 7 shows the correlation between the aforementioned properties with the mass-to-size ratio (M★/Re). We also estimated the Spearman rank coefficient (ρ) between the various quantities depicted in Fig. 7. The values are shown in the top left corner of each panel.
Examining the average trend in Z★, we find that galaxies below the size–mass relation tend to be metal-rich, consistent with their compact morphology and dense stellar populations (e.g., Beverage et al. 2021; Euclid Collaboration: Corcho-Caballero et al. 2025). In contrast, galaxies above the relation exhibit a wider range of metallicities but, on average, have lower Z★, particularly at lower stellar masses. However, the Spearman rank coefficient between Re and Z★ suggests a flat relation (ρ = 0.06). A much stronger correlation is observed between Z★ and M★/Re (ρ = 0.44), indicating that quiescent galaxies with a stronger gravitational potential well (Φ ∝ M★/Re) retain a higher metallicity content (e.g., Barone et al. 2018). As M★/Re is decreasing, we observe a decrease in Z★. This finding supports the idea that galaxy size plays a role in regulating the chemical composition of massive quiescent galaxies. Our results are consistent with Beverage et al. (2021), who analyzed 65 massive quiescent galaxies from the LEGA-C survey, demonstrating that chemical enrichment is governed by a galaxy’s gravitational potential (as traced by M★/Re) (see also Zibetti & Gallazzi 2022). In Gallazzi et al. (2025a), a similar correlation is shown between Z★ and stellar velocity dispersion (σ★2 ∼ M★/Re) at fixed M★, as well as a correlation with M★ at fixed σ★. Finally, Baker et al. (2024) showed that Z★ in passive galaxies is primarily driven by σ★, concluding that black hole feedback plays a key role in quenching by suppressing gas inflows, enhancing Z★, and ultimately halting star formation.
The average trend with zform suggests that quiescent galaxies 1σ (0.23 dex) above the size–mass relation formed 50% of their stellar mass more recently than those 1σ below it, implying that more compact galaxies formed earlier. However, the overall correlation between zform and size remains weak (ρ = 0.07). We also find a hint of a positive trend between zform with M★ (ρ = 0.22). A stronger trend between zform and M★ has been reported by Belli et al. (2019), whereas Carnall et al. (2019) and Tacchella et al. (2022) reported only a negligible dependence of zform with stellar mass, in agreement with our results. Furthermore, zform shows a weak positive correlation with M★/Re (ρ = 0.22), indicating that galaxies with stronger gravitational potentials tend to form earlier (i.e., are older). For a sample of 625 quiescent galaxies from the SAMI Galaxy Survey (Bryant et al. 2015), Barone et al. (2018) found a moderate positive correlation between stellar population age and M★/Re (ρ = 0.39). Beverage et al. (2021) reported an opposite but similarly weak trend between stellar age and M★/Re (ρ = −0.1), though their sample was limited to 65 LEGA-C galaxies. Based on DN4000 measurements, Wu et al. (2018a) found that at a fixed stellar mass, smaller quiescent galaxies tend to be older, consistent with our results.
The general trends with Z★ and zform shown in Fig. 7 remain consistent regardless of the method used to derive the stellar properties. We confirmed these trends using alternative estimates of the mass-weighted age and metallicity from both BaStA (Gallazzi et al. 2025a) and BAGPIPES (Kaushal et al. 2024), consistently finding that relatively large quiescent galaxies tend to quench later and have lower stellar metallicities (see Appendix B).
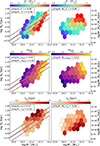 |
Fig. 7. Mean stellar population properties and quenching timescales of quiescent galaxies on the size–mass plane (left), and M★/Re vs. M★ (right). The panels (from top to bottom) display stellar metallicity (Z★), formation redshift (zform), and quenching timescale (τq). The solid red line is the best-fit size–mass relation for the quiescent population. The dashed black lines indicate the 1σ deviation from the best-fit relation. The stellar properties and quenching times were averaged using the LOESS method. Each hexbin contains at least five galaxies. In the top left corner of each panel we show the Spearman rank coefficients (ρ). |
At fixed stellar mass, we find that, on average, τq increases with galaxy size, aligning with our results in Fig. 6. Quiescent galaxies above or on the size–mass relation quench more slowly than those below the relation. However, we find a negligible correlation between size and quenching timescale (ρ = 0.11). Conversely, compact quiescent galaxies undergo a faster quenching than extended quiescent galaxies of the same mass (see also Appendix C for a comparison between the spectra of rapid-, fast-, and slow-quenching galaxies of similar mass). We also find a weak negative correlation between τq and M★/Re (ρ = −0.08), where, at fixed mass, galaxies with stronger gravitational potentials quench more rapidly.
In Figure 8, we summarize the key trends in stellar metallicity, zform, quenching time, and galaxy size by plotting the median trends for the quiescent galaxies in four size bins based on the size metric Δlog(Re), as well as the PSB population. The median quenching timescales in each size bin were calculated based on the τq values as measured from the individual SFHs of the quiescent population. From this figure, we can infer that larger quiescent galaxies tend to have longer quenching timescales and near-solar metallicities, while the most compact systems quench faster and are metal-rich. In terms of zform, there is marginal evidence that compact quiescent galaxies formed earlier (zform ≃ 2.9) than their more extended counterparts (zform ≃ 2.7), corresponding to a time difference of about 200 Myr.
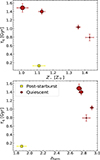 |
Fig. 8. Median quenching timescales as a function of stellar metallicity (top) and formation redshift (bottom) for the quiescent galaxy population. We separated the data into four size bins: Δlog(Re)≤ − 0.23, −0.23 < Δlog(Re) < 0, 0 < Δlog(Re) < 0.23, and Δlog(Re)≥0.23. The larger circles correspond to larger galaxies. The yellow square marks the median value measured for the PSB population. The error bars indicate the statistical uncertainty on the median ( |

These trends supports the idea that galaxy size influences chemical enrichment (Beverage et al. 2021). The observed change in metallicity may be driven by dry minor merger events, as the accretion of low-mass metal-poor satellites could decrease the metallicity of the progenitor galaxy (e.g., Shankar et al. 2010; Carollo et al. 2013). In contrast, compact galaxies likely formed stars rapidly and early, leading to high metal enrichment via limited dilution from pristine gas, and strong AGN or supernova feedback, or intense starbursts, that can rapidly deplete the available cold gas within a few hundred megayears (Zolotov et al. 2015; Wu et al. 2018a; Chauke et al. 2019; Wu et al. 2020b).
The median size of the 84 PSBs in our sample lies just below the size–mass relation, placing them in the second size bin (i.e., −0.23 < Δlog(Re) < 0). Based on their median properties, we find that PSBs undergo the most rapid quenching among the quiescent population, with a median quenching timescale of ⟨τq⟩ = 0.13 ± 0.03 Gyr. This short timescale aligns with both observational studies at similar redshifts (e.g., Wild et al. 2020) and cosmological hydrodynamic models, which suggest that rapid quenching can also be driven either by the mechanical expulsion of gas due to AGN activity (e.g., Rodríguez Montero et al. 2019) or by major mergers and multiple minor mergers (Pawlik et al. 2019; Davis et al. 2019). Additionally, Park et al. (2023) reported similarly a fast quenching timescale for 12 young quiescent galaxies at z ∼ 1.5, with an average transition time of 0.3 Gyr. There is also ample evidence of fast quenching at higher redshifts, as highlighted in several recent studies (Carnall et al. 2023b, 2024; de Graaff et al. 2024; Urbano Stawinski et al. 2024; Weibel et al. 2025; Turner et al. 2025).
The median stellar metallicity of PSBs is higher than that of the largest quiescent galaxies, but lower than that of the most compact ones. The high metallicities of PSBs are consistent with recent findings from 45 local PSB galaxies in the MaNGA survey (Leung et al. 2024), which showed that most PSBs experienced significant metallicity enrichment during recent starbursts, supporting a merger-driven origin involving rapid quenching and efficient metal recycling. Finally, PSBs formed 50% of their stellar mass significantly later (by ∼1 Gyr) than the rest of the quiescent galaxies in our sample.
An interesting avenue for future work is to link our results on quenching timescales and galaxy sizes with chemical abundance patterns, particularly α-enhancement. Upcoming capabilities in Prospector will allow for self-consistent α-enhanced models, which are expected to be crucial for deriving accurate physical properties of high-redshift galaxies (Park et al. 2025).
5. Discussion
5.1. Multiple pathways to quiescence
Observational studies show that, at a fixed stellar mass, larger quiescent galaxies tend to be younger, as indicated by stellar age tracers such as DN4000 and Hδ (Wu et al. 2018a). Several other studies have similarly reported that younger galaxies tend to be larger in size (e.g., Ribeiro et al. 2016; Fagioli et al. 2016; Williams et al. 2017; Wu et al. 2018a; Baes et al. 2020; Barone et al. 2022; Nersesian et al. 2023), with size growth attributed to young stars forming at larger radii or minor mergers contributing to the outskirts (e.g., van Dokkum et al. 2010; Vulcani et al. 2014; Shankar et al. 2015; Oogi et al. 2016). However, some studies suggest only a weak correlation between size growth and in situ star formation (e.g., van Dokkum et al. 2013; van der Wel et al. 2014; van Dokkum et al. 2015; Whitaker et al. 2017). Regardless, galaxies evolve along different quenching pathways, undergoing morphological transformations in the process.
Cosmological simulations suggest that quenching timescale decreases with stellar mass. High-mass galaxies (M★ > 1011 M⊙) at z ∼ 0 quench within ∼1 Gyr, while lower-mass galaxies (M ★ < 1010 M⊙) take 2–3 Gyr (Nelson et al. 2018; Park et al. 2022). Simulations also indicate that smaller star-forming galaxies quench earlier (Genel et al. 2018), while more extended massive galaxies at z ∼ 2 quench later (Gupta et al. 2021). These discrepancies may be attributed to differences in the epoch of observations, with environmental quenching occurring at lower redshifts (e.g., Moutard et al. 2018; Webb et al. 2020). Observations show a very weak decreasing trend between quenching timescales and increasing stellar mass, with massive halos having shorter quenching timescales (Tacchella et al. 2022, albeit their sample of galaxies is limited and the uncertainties on the halo masses are large).
Our results reinforce the idea that galaxies follow a broad diversity of quenching pathways, ranging from rapid to slow quenching (e.g., Barro et al. 2016; Wu et al. 2018a; Moutard et al. 2018; Belli et al. 2019; Moutard et al. 2020; Tacchella et al. 2022). The majority of quiescent galaxies quench on timescales of ∼1 Gyr or longer, significantly exceeding the typical dynamical time (∼0.1 Gyr). This suggests that gradual processes such as gas depletion and strangulation dominate for most galaxies, producing minimal structural changes (Leroy et al. 2008; Schiminovich et al. 2010; Bigiel et al. 2011; Saintonge et al. 2011; Schruba et al. 2011; Huang et al. 2012; Tacconi et al. 2013; Genzel et al. 2015; Tacconi et al. 2018, 2020). In contrast, only a subset of galaxies, such as PSBs, quench on very short timescales of ≲0.1–0.3 Gyr, consistent with the dynamical timescales of violent processes such as mergers, disk instabilities, or AGN-driven feedback, which can rapidly transform galaxies into compact remnants (Zolotov et al. 2015; Tacchella et al. 2016).
Based on the median trends in Fig. 8, we find that compact quiescent galaxies are consistent with both early, moderately fast quenching and with more rapid, late quenching. While this may suggest the existence of multiple quenching channels, our data are also compatible with a continuous distribution of quenching timescales, as argued by Martin et al. (2007) in the local Universe. In either case, the results indicate that different physical mechanisms can drive quenching across galaxy populations, potentially producing similar morphological outcomes despite diverse evolutionary histories.
5.2. Caveats
There are several sources of uncertainty that could potentially impact the conclusions of our analysis. One of these uncertainties is the definition of the transitioning and quiescence boundaries, that directly influences the calculation of τq. In this work, we adopted the boundaries from Tacchella et al. (2022), who analyzed 161 massive quiescent galaxies at similar redshifts (zobs ∼ 0.8). In Fig. A.1, we show that these boundaries represent the LEGA-C sample exceptionally well. Moreover, Tacchella et al. (2022) found that this definition introduces no systematic bias in τq, except for a subset of rapidly quenching galaxies, where the timescales tend to be overestimated. While small shifts in the boundary definitions could lead to variations in the measured τq, we tested alternative thresholds (keeping the width of the transition zone fixed) and found that the resulting differences in τq were typically around 0.15 Gyr. Therefore, the median quenching timescales remain largely unaffected, and we conclude that the adopted definition is appropriate for our analysis.
We caution that part of the apparent decline in the early star formation activity may be influenced by our SFH parameterization. In our non-parametric model, the SFR is assumed to be piecewise constant in lookback time bins, while the stellar mass grows monotonically. This naturally drives a decline in the inferred specific SFR with cosmic time, even if the underlying SFR is flat. As a result, the early decline seen in Fig. 4–6 should not be overinterpreted as a robust physical trend. Rather, it reflects in part the modeling assumptions, and similar declines would appear under this parameterization regardless of the true early SFH. A detailed comparison of different SFH models would be required to disentangle physical trends from modeling artifacts.
This analysis also assumes that each SFH represents the evolution of a single galaxy. In reality, some of the quiescent galaxies in our sample may have experienced multiple merger events prior to observation. In such cases, the reconstructed SFH could reflect a composite history of multiple progenitors rather than a single evolutionary track. This blending can bias the measurement of key parameters (e.g., τq) that can potentially smooth out signatures of rapid quenching.
Another source of uncertainty arises from the measurement of mass-weighted stellar ages and metallicities. Within the LEGA-C team, these properties are derived by combining spectra and photometry using three SED fitting methods: BAGPIPES (Kaushal et al. 2024), Prospector (Nersesian et al. 2025), and BaStA (Gallazzi et al. 2025a). A detailed comparison in Gallazzi et al. (2025a, see their Appendix E) reveals notable discrepancies in stellar metallicity, with variations up to 0.2 dex for quiescent galaxies and 0.4 dex for star-forming ones. These differences partly stem from methodology: Prospector and BAGPIPES assume a constant metallicity over time, while BaStA provides light-weighted averages. Differences in the range of metallicity values also contribute to the increased scatter among the three SED fitting methods. For quiescent galaxies, age estimates are more consistent (within ∼0.08 dex) between BaStA and Prospector, though BAGPIPES often clusters ages around log(Age/yr)∼9.5. For star-forming galaxies, age estimates across methods show better agreement overall, though uncertainties from Prospector and BAGPIPES still appear underestimated. Despite the large one-to-one variations among the different fitting methods, the average trends we presented in this work are consistent (see Appendix B).
6. Summary and conclusions
In this paper, we investigated the relationship between galaxy sizes, SFHs, quenching times, and stellar population properties by leveraging spectrophotometric modeling results from Prospector (Leja et al. 2017; Johnson et al. 2021) and the LEGA-C DR3 dataset (Nersesian et al. 2025). The main goal of our analysis was to determine whether there is a link between galaxy sizes, SFHs, and quenching times. From the trends of the median SFHs in Fig. 5, and Fig. 6, we report the following:
-
Galaxies at redshift 0.6 < z < 1 show a great diversity of SFHs, with galaxies either actively star-forming, transitioning, or quenching. We measure that the transition from star formation to quiescence lasted on average ⟨τq⟩ = 1.23 ± 0.04 Gyr. Spectroscopically selected, compact PSB galaxies quenched on average much more rapidly with ⟨τq⟩ = 0.13 ± 0.03 Gyr.
-
At a fixed size, the most massive star-forming galaxies transition earlier than the less massive ones. This observation aligns with the downsizing scenario, where more massive galaxies tend to quench earlier. At a fixed stellar mass, we find a subtle indication that larger galaxies sustain their star formation activity for a longer duration compared to their smaller counterparts.
-
At a fixed stellar mass, quiescent galaxies lying 1σ (0.23 dex) below the size–mass relation quench faster than galaxies on or 1σ above the size–mass relation. At a fixed size, we do not find clear evidence of a strong trend between quenching timescale and stellar mass, and if such a trend exists, it is rather weak.
Based on the τq measurements from the individual SFHs of quiescent galaxies, and the median trends of τq as a function of galaxy size, stellar metallicity, and formation redshift (Fig. 7 and Fig. 8), we find the following:
-
Larger quiescent galaxies quench more slowly and have near-solar metallicities, while the most compact quiescent galaxies, having a strong gravitational potential, are found to be metal-rich and to quench significantly faster. This supports the idea that galaxy size can regulate the chemical enrichment of galaxies (Beverage et al. 2021). The observed change in metallicity may be driven by dry minor merger events, as the accretion of low-mass metal-poor satellites could decrease the metallicity of the progenitor galaxy. In this case, longer τq could simply reflect the mixing of different stellar population that quenched at different times, thus stretching the effective τq we measured on the integrated population.
-
Larger quiescent galaxies also tend to be marginally younger, while compact quiescent galaxies seem consistent with both early, moderately fast quenching and with more rapid, late quenching. While this may suggest the existence of multiple quenching channels, our data are also compatible with a continuous distribution of quenching timescales. These findings suggest that different physical mechanisms drive quenching across galaxy populations, potentially leading to similar morphological outcomes despite differing evolutionary histories.
Acknowledgments
AN gratefully acknowledges the support of the Belgian Federal Science Policy Office (BELSPO) for the provision of financial support in the framework of the PRODEX Programme of the European Space Agency (ESA) under contract number 4000143347. PFW acknowledges funding through the National Science and Technology Council grants 113-2112-M-002-027-MY2. ARG acknowledges support from the INAF-Minigrant-2022 "LEGA-C" 1.05.12.04.01. This research made use of Astropy, (http://www.astropy.org) a community-developed core Python package for Astronomy (Astropy Collaboration 2013, 2018).
References
- Almaini, O., Wild, V., Maltby, D. T., et al. 2017, MNRAS, 472, 1401 [NASA ADS] [CrossRef] [Google Scholar]
- Astropy Collaboration (Robitaille, T. P., et al.) 2013, A&A, 558, A33 [NASA ADS] [CrossRef] [EDP Sciences] [Google Scholar]
- Astropy Collaboration (Price-Whelan, A. M., et al.) 2018, AJ, 156, 123 [Google Scholar]
- Baes, M., Nersesian, A., Casasola, V., et al. 2020, A&A, 641, A119 [NASA ADS] [CrossRef] [EDP Sciences] [Google Scholar]
- Baker, W. M., Maiolino, R., Bluck, A. F. L., et al. 2024, MNRAS, 534, 30 [Google Scholar]
- Baldry, I. K., Glazebrook, K., Brinkmann, J., et al. 2004, ApJ, 600, 681 [Google Scholar]
- Balogh, M. L., Morris, S. L., Yee, H. K. C., Carlberg, R. G., & Ellingson, E. 1999, ApJ, 527, 54 [Google Scholar]
- Barišić, I., van der Wel, A., Bezanson, R., et al. 2017, ApJ, 847, 72 [Google Scholar]
- Barone, T. M., D’Eugenio, F., Colless, M., et al. 2018, ApJ, 856, 64 [Google Scholar]
- Barone, T. M., D’Eugenio, F., Colless, M., & Scott, N. 2020, ApJ, 898, 62 [NASA ADS] [CrossRef] [Google Scholar]
- Barone, T. M., D’Eugenio, F., Scott, N., et al. 2022, MNRAS, 512, 3828 [NASA ADS] [CrossRef] [Google Scholar]
- Barro, G., Faber, S. M., Dekel, A., et al. 2016, ApJ, 820, 120 [Google Scholar]
- Barro, G., Faber, S. M., Koo, D. C., et al. 2017, ApJ, 840, 47 [Google Scholar]
- Belli, S., Genzel, R., Förster Schreiber, N. M., et al. 2017, ApJ, 841, L6 [NASA ADS] [CrossRef] [Google Scholar]
- Belli, S., Newman, A. B., & Ellis, R. S. 2019, ApJ, 874, 17 [Google Scholar]
- Best, P. N., Kauffmann, G., Heckman, T. M., et al. 2005, MNRAS, 362, 25 [Google Scholar]
- Beverage, A. G., Kriek, M., Conroy, C., et al. 2021, ApJ, 917, L1 [NASA ADS] [CrossRef] [Google Scholar]
- Bigiel, F., Leroy, A. K., Walter, F., et al. 2011, ApJ, 730, L13 [NASA ADS] [CrossRef] [Google Scholar]
- Birnboim, Y., & Dekel, A. 2003, MNRAS, 345, 349 [Google Scholar]
- Birnboim, Y., Dekel, A., & Neistein, E. 2007, MNRAS, 380, 339 [NASA ADS] [CrossRef] [Google Scholar]
- Boissier, S., Boselli, A., Ferrarese, L., et al. 2016, A&A, 593, A126 [NASA ADS] [CrossRef] [EDP Sciences] [Google Scholar]
- Brinchmann, J., Charlot, S., White, S. D. M., et al. 2004, MNRAS, 351, 1151 [Google Scholar]
- Bryant, J. J., Owers, M. S., Robotham, A. S. G., et al. 2015, MNRAS, 447, 2857 [Google Scholar]
- Cappellari, M. 2023, MNRAS, 526, 3273 [NASA ADS] [CrossRef] [Google Scholar]
- Cappellari, M., McDermid, R. M., Alatalo, K., et al. 2013, MNRAS, 432, 1862 [NASA ADS] [CrossRef] [Google Scholar]
- Carnall, A. C., McLure, R. J., Dunlop, J. S., & Davé, R. 2018, MNRAS, 480, 4379 [Google Scholar]
- Carnall, A. C., McLure, R. J., Dunlop, J. S., et al. 2019, MNRAS, 490, 417 [Google Scholar]
- Carnall, A. C., McLeod, D. J., McLure, R. J., et al. 2023a, MNRAS, 520, 3974 [NASA ADS] [CrossRef] [Google Scholar]
- Carnall, A. C., McLure, R. J., Dunlop, J. S., et al. 2023b, Nature, 619, 716 [NASA ADS] [CrossRef] [Google Scholar]
- Carnall, A. C., Cullen, F., McLure, R. J., et al. 2024, MNRAS, 534, 325 [NASA ADS] [CrossRef] [Google Scholar]
- Carollo, C. M., Bschorr, T. J., Renzini, A., et al. 2013, ApJ, 773, 112 [NASA ADS] [CrossRef] [Google Scholar]
- Cecchi, R., Bolzonella, M., Cimatti, A., & Girelli, G. 2019, ApJ, 880, L14 [NASA ADS] [CrossRef] [Google Scholar]
- Chabrier, G. 2003, PASP, 115, 763 [Google Scholar]
- Chauke, P., van der Wel, A., Pacifici, C., et al. 2018, ApJ, 861, 13 [NASA ADS] [CrossRef] [Google Scholar]
- Chauke, P., van der Wel, A., Pacifici, C., et al. 2019, ApJ, 877, 48 [NASA ADS] [CrossRef] [Google Scholar]
- Cheung, E., Bundy, K., Cappellari, M., et al. 2016, Nature, 533, 504 [NASA ADS] [CrossRef] [Google Scholar]
- Choi, J., Dotter, A., Conroy, C., et al. 2016, ApJ, 823, 102 [Google Scholar]
- Ciesla, L., Boquien, M., Boselli, A., et al. 2014, A&A, 565, A128 [NASA ADS] [CrossRef] [EDP Sciences] [Google Scholar]
- Cleveland, W. S., & Devlin, S. J. 1988, J. Am. Stat. Assoc., 83, 596 [CrossRef] [Google Scholar]
- Cowie, L. L., & Barger, A. J. 2008, ApJ, 686, 72 [NASA ADS] [CrossRef] [Google Scholar]
- Crenshaw, D. M., Kraemer, S. B., & George, I. M. 2003, ARA&A, 41, 117 [NASA ADS] [CrossRef] [Google Scholar]
- Croton, D. J., Springel, V., White, S. D. M., et al. 2006, MNRAS, 365, 11 [Google Scholar]
- Daddi, E., Dickinson, M., Morrison, G., et al. 2007, ApJ, 670, 156 [NASA ADS] [CrossRef] [Google Scholar]
- Daddi, E., Delvecchio, I., Dimauro, P., et al. 2022, A&A, 661, L7 [NASA ADS] [CrossRef] [EDP Sciences] [Google Scholar]
- Davis, T. A., van de Voort, F., Rowlands, K., et al. 2019, MNRAS, 484, 2447 [Google Scholar]
- de Graaff, A., Setton, D. J., Brammer, G., et al. 2024, Nat. Astron. [arXiv:2404.05683] [Google Scholar]
- Dekel, A., & Birnboim, Y. 2006, MNRAS, 368, 2 [NASA ADS] [CrossRef] [Google Scholar]
- Dome, T., Tacchella, S., Fialkov, A., et al. 2024, MNRAS, 527, 2139 [Google Scholar]
- Donnari, M., Pillepich, A., Nelson, D., et al. 2019, MNRAS, 485, 4817 [Google Scholar]
- Dressler, A., & Gunn, J. E. 1983, ApJ, 270, 7 [NASA ADS] [CrossRef] [Google Scholar]
- Dressler, A., Smail, I., Poggianti, B. M., et al. 1999, ApJS, 122, 51 [NASA ADS] [CrossRef] [Google Scholar]
- Elbaz, D., Daddi, E., Le Borgne, D., et al. 2007, A&A, 468, 33 [NASA ADS] [CrossRef] [EDP Sciences] [Google Scholar]
- Euclid Collaboration (Corcho-Caballero, P., et al.) 2025, A&A, accepted, (Euclid Q1 SI), http://dx.doi.org/10.1051/0004-6361/202554582 [Google Scholar]
- Fabian, A. C. 2012, ARA&A, 50, 455 [Google Scholar]
- Fagioli, M., Carollo, C. M., Renzini, A., et al. 2016, ApJ, 831, 173 [NASA ADS] [CrossRef] [Google Scholar]
- Fang, J. J., Faber, S. M., Koo, D. C., et al. 2018, ApJ, 858, 100 [NASA ADS] [CrossRef] [Google Scholar]
- Fontanot, F., De Lucia, G., Monaco, P., Somerville, R. S., & Santini, P. 2009, MNRAS, 397, 1776 [NASA ADS] [CrossRef] [Google Scholar]
- Fu, H., Shankar, F., Ayromlou, M., et al. 2024, MNRAS, 532, 177 [NASA ADS] [CrossRef] [Google Scholar]
- Fumagalli, M., Labbé, I., Patel, S. G., et al. 2014, ApJ, 796, 35 [Google Scholar]
- Furlong, M., Bower, R. G., Crain, R. A., et al. 2017, MNRAS, 465, 722 [Google Scholar]
- Gallazzi, A., Charlot, S., Brinchmann, J., White, S. D. M., & Tremonti, C. A. 2005, MNRAS, 362, 41 [Google Scholar]
- Gallazzi, A., Bell, E. F., Zibetti, S., Brinchmann, J., & Kelson, D. D. 2014, ApJ, 788, 72 [Google Scholar]
- Gallazzi, A. R., Zibetti, S., van der Wel, A., et al. 2025a, arXiv e-prints [arXiv:2512.07952] [Google Scholar]
- Gallazzi, A. R., Zibetti, S., van der Wel, A., et al. 2025b, accepted, [arXiv:2511.11805] [Google Scholar]
- Genel, S., Nelson, D., Pillepich, A., et al. 2018, MNRAS, 474, 3976 [Google Scholar]
- Genzel, R., Tacconi, L. J., Lutz, D., et al. 2015, ApJ, 800, 20 [Google Scholar]
- Graham, A. W. 2013, in Planets, Stars and Stellar Systems. Volume 6: Extragalactic Astronomy and Cosmology, eds. T. D. Oswalt, & W. C. Keel, 6, 91 [Google Scholar]
- Grogin, N. A., Kocevski, D. D., Faber, S. M., et al. 2011, ApJS, 197, 35 [NASA ADS] [CrossRef] [Google Scholar]
- Gupta, A., Tran, K.-V., Pillepich, A., et al. 2021, ApJ, 907, 95 [Google Scholar]
- Hamadouche, M. L., Carnall, A. C., McLure, R. J., et al. 2022, MNRAS, 512, 1262 [NASA ADS] [CrossRef] [Google Scholar]
- Harrison, C. M. 2017, Nat. Astron., 1, 0165 [NASA ADS] [CrossRef] [Google Scholar]
- Henden, N. A., Puchwein, E., Shen, S., & Sijacki, D. 2018, MNRAS, 479, 5385 [CrossRef] [Google Scholar]
- Huang, S., Haynes, M. P., Giovanelli, R., & Brinchmann, J. 2012, ApJ, 756, 113 [Google Scholar]
- Ibarra-Medel, H. J., Sánchez, S. F., Avila-Reese, V., et al. 2016, MNRAS, 463, 2799 [NASA ADS] [CrossRef] [Google Scholar]
- Jain, S., Tacchella, S., & Mosleh, M. 2024, Open J. Astrophys., 7, 113 [Google Scholar]
- Johnson, B. D., Leja, J., Conroy, C., & Speagle, J. S. 2021, ApJS, 254, 22 [NASA ADS] [CrossRef] [Google Scholar]
- Kaushal, Y., Nersesian, A., Bezanson, R., et al. 2024, ApJ, 961, 118 [NASA ADS] [CrossRef] [Google Scholar]
- Keating, S. K., Abraham, R. G., Schiavon, R., et al. 2015, ApJ, 798, 26 [Google Scholar]
- Kereš, D., Katz, N., Weinberg, D. H., & Davé, R. 2005, MNRAS, 363, 2 [Google Scholar]
- Koekemoer, A. M., Faber, S. M., Ferguson, H. C., et al. 2011, ApJS, 197, 36 [NASA ADS] [CrossRef] [Google Scholar]
- Koprowski, M. P., Wijesekera, J. V., Dunlop, J. S., et al. 2024, A&A, 691, A164 [NASA ADS] [CrossRef] [EDP Sciences] [Google Scholar]
- Labbé, I., Huang, J., Franx, M., et al. 2005, ApJ, 624, L81 [Google Scholar]
- Lange, R., Driver, S. P., Robotham, A. S. G., et al. 2015, MNRAS, 447, 2603 [CrossRef] [Google Scholar]
- Lee, N., Sanders, D. B., Casey, C. M., et al. 2015, ApJ, 801, 80 [Google Scholar]
- Leja, J., Johnson, B. D., Conroy, C., van Dokkum, P. G., & Byler, N. 2017, ApJ, 837, 170 [NASA ADS] [CrossRef] [Google Scholar]
- Leja, J., Carnall, A. C., Johnson, B. D., Conroy, C., & Speagle, J. S. 2019a, ApJ, 876, 3 [Google Scholar]
- Leja, J., Johnson, B. D., Conroy, C., et al. 2019b, ApJ, 877, 140 [NASA ADS] [CrossRef] [Google Scholar]
- Leja, J., Tacchella, S., & Conroy, C. 2019c, ApJ, 880, L9 [NASA ADS] [CrossRef] [Google Scholar]
- Leja, J., Speagle, J. S., Ting, Y.-S., et al. 2022, ApJ, 936, 165 [NASA ADS] [CrossRef] [Google Scholar]
- Leroy, A. K., Walter, F., Brinks, E., et al. 2008, AJ, 136, 2782 [Google Scholar]
- Leslie, S. K., Schinnerer, E., Liu, D., et al. 2020, ApJ, 899, 58 [Google Scholar]
- Leung, H.-H., Wild, V., Papathomas, M., et al. 2024, MNRAS, 528, 4029 [Google Scholar]
- Lilly, S. J., & Carollo, C. M. 2016, ApJ, 833, 1 [NASA ADS] [CrossRef] [Google Scholar]
- Lower, S., Narayanan, D., Leja, J., et al. 2020, ApJ, 904, 33 [NASA ADS] [CrossRef] [Google Scholar]
- Maltby, D. T., Almaini, O., Wild, V., et al. 2018, MNRAS, 480, 381 [CrossRef] [Google Scholar]
- Martin, D. C., Wyder, T. K., Schiminovich, D., et al. 2007, ApJS, 173, 342 [NASA ADS] [CrossRef] [Google Scholar]
- Martorano, M., van der Wel, A., Baes, M., et al. 2024, ApJ, 972, 134 [Google Scholar]
- Martorano, M., van der Wel, A., Baes, M., et al. 2025, A&A, 694, A76 [NASA ADS] [CrossRef] [EDP Sciences] [Google Scholar]
- McDermid, R. M., Alatalo, K., Blitz, L., et al. 2015, MNRAS, 448, 3484 [Google Scholar]
- Merlin, E., Fontana, A., Castellano, M., et al. 2018, MNRAS, 473, 2098 [Google Scholar]
- Mitra, S., Davé, R., & Finlator, K. 2015, MNRAS, 452, 1184 [NASA ADS] [CrossRef] [Google Scholar]
- Moresco, M., Pozzetti, L., Cimatti, A., et al. 2013, A&A, 558, A61 [NASA ADS] [CrossRef] [EDP Sciences] [Google Scholar]
- Moutard, T., Sawicki, M., Arnouts, S., et al. 2018, MNRAS, 479, 2147 [NASA ADS] [CrossRef] [Google Scholar]
- Moutard, T., Malavasi, N., Sawicki, M., Arnouts, S., & Tripathi, S. 2020, MNRAS, 495, 4237 [CrossRef] [Google Scholar]
- Muzzin, A., Marchesini, D., Stefanon, M., et al. 2013a, ApJ, 777, 18 [NASA ADS] [CrossRef] [Google Scholar]
- Muzzin, A., Marchesini, D., Stefanon, M., et al. 2013b, ApJS, 206, 8 [Google Scholar]
- Nelson, D., Pillepich, A., Springel, V., et al. 2018, MNRAS, 475, 624 [Google Scholar]
- Nersesian, A., Zibetti, S., D’Eugenio, F., & Baes, M. 2023, A&A, 673, A63 [NASA ADS] [CrossRef] [EDP Sciences] [Google Scholar]
- Nersesian, A., van der Wel, A., Gallazzi, A., et al. 2024, A&A, 681, A94 [NASA ADS] [CrossRef] [EDP Sciences] [Google Scholar]
- Nersesian, A., van der Wel, A., Gallazzi, A. R., et al. 2025, A&A, 695, A86 [NASA ADS] [CrossRef] [EDP Sciences] [Google Scholar]
- Noeske, K. G., Weiner, B. J., Faber, S. M., et al. 2007, ApJ, 660, L43 [CrossRef] [Google Scholar]
- Norris, M. A., Kannappan, S. J., Forbes, D. A., et al. 2014, MNRAS, 443, 1151 [NASA ADS] [CrossRef] [Google Scholar]
- Oogi, T., Habe, A., & Ishiyama, T. 2016, MNRAS, 456, 300 [NASA ADS] [CrossRef] [Google Scholar]
- Pacifici, C., Kassin, S. A., Weiner, B. J., et al. 2016, ApJ, 832, 79 [Google Scholar]
- Park, M., Tacchella, S., Nelson, E. J., et al. 2022, MNRAS, 515, 213 [NASA ADS] [CrossRef] [Google Scholar]
- Park, M., Belli, S., Conroy, C., et al. 2023, ApJ, 953, 119 [NASA ADS] [CrossRef] [Google Scholar]
- Park, M., Conroy, C., Johnson, B. D., et al. 2025, ApJ, 994, 165 [Google Scholar]
- Paspaliaris, E. D., Xilouris, E. M., Nersesian, A., et al. 2023, A&A, 669, A11 [NASA ADS] [CrossRef] [EDP Sciences] [Google Scholar]
- Pawlik, M. M., McAlpine, S., Trayford, J. W., et al. 2019, Nat. Astron., 3, 440 [Google Scholar]
- Peng, Y.-J., Lilly, S. J., Kovač, K., et al. 2010, ApJ, 721, 193 [Google Scholar]
- Pillepich, A., Springel, V., Nelson, D., et al. 2018, MNRAS, 473, 4077 [Google Scholar]
- Poggianti, B. M., Aragón-Salamanca, A., Zaritsky, D., et al. 2009, ApJ, 693, 112 [NASA ADS] [CrossRef] [Google Scholar]
- Popesso, P., Concas, A., Cresci, G., et al. 2023, MNRAS, 519, 1526 [Google Scholar]
- Ribeiro, B., Le Fèvre, O., Tasca, L. A. M., et al. 2016, A&A, 593, A22 [NASA ADS] [CrossRef] [EDP Sciences] [Google Scholar]
- Rodríguez Montero, F., Davé, R., Wild, V., Anglés-Alcázar, D., & Narayanan, D. 2019, MNRAS, 490, 2139 [CrossRef] [Google Scholar]
- Saintonge, A., Kauffmann, G., Wang, J., et al. 2011, MNRAS, 415, 61 [NASA ADS] [CrossRef] [Google Scholar]
- Salmon, B., Papovich, C., Finkelstein, S. L., et al. 2015, ApJ, 799, 183 [NASA ADS] [CrossRef] [Google Scholar]
- Sánchez-Blázquez, P., Peletier, R. F., Jiménez-Vicente, J., et al. 2006, MNRAS, 371, 703 [Google Scholar]
- Schiminovich, D., Catinella, B., Kauffmann, G., et al. 2010, MNRAS, 408, 919 [CrossRef] [Google Scholar]
- Schreiber, C., Elbaz, D., Pannella, M., et al. 2016, A&A, 589, A35 [NASA ADS] [CrossRef] [EDP Sciences] [Google Scholar]
- Schreiber, C., Glazebrook, K., Nanayakkara, T., et al. 2018, A&A, 618, A85 [NASA ADS] [CrossRef] [EDP Sciences] [Google Scholar]
- Schruba, A., Leroy, A. K., Walter, F., et al. 2011, AJ, 142, 37 [NASA ADS] [CrossRef] [Google Scholar]
- Scoville, N., Aussel, H., Brusa, M., et al. 2007, ApJS, 172, 1 [Google Scholar]
- Semenov, V. A., Kravtsov, A. V., & Gnedin, N. Y. 2021, ApJ, 918, 13 [NASA ADS] [CrossRef] [Google Scholar]
- Sérsic, J. L. 1963, Boletin de la Asociacion Argentina de Astronomia La Plata Argentina, 6, 41 [Google Scholar]
- Setton, D. J., Verrico, M., Bezanson, R., et al. 2022, ApJ, 931, 51 [NASA ADS] [CrossRef] [Google Scholar]
- Shankar, F., Marulli, F., Bernardi, M., et al. 2010, MNRAS, 403, 117 [Google Scholar]
- Shankar, F., Mei, S., Huertas-Company, M., et al. 2014, MNRAS, 439, 3189 [NASA ADS] [CrossRef] [Google Scholar]
- Shankar, F., Buchan, S., Rettura, A., et al. 2015, ApJ, 802, 73 [NASA ADS] [CrossRef] [Google Scholar]
- Shen, S., Mo, H. J., White, S. D. M., et al. 2003, MNRAS, 343, 978 [NASA ADS] [CrossRef] [Google Scholar]
- Snyder, G. F., Cox, T. J., Hayward, C. C., Hernquist, L., & Jonsson, P. 2011, ApJ, 741, 77 [NASA ADS] [CrossRef] [Google Scholar]
- Speagle, J. S., Steinhardt, C. L., Capak, P. L., & Silverman, J. D. 2014, ApJS, 214, 15 [Google Scholar]
- Springel, V., Di Matteo, T., & Hernquist, L. 2005, ApJ, 620, L79 [Google Scholar]
- Straatman, C. M. S., van der Wel, A., Bezanson, R., et al. 2018, ApJS, 239, 27 [NASA ADS] [CrossRef] [Google Scholar]
- Strateva, I., Ivezić, Ž., Knapp, G. R., et al. 2001, AJ, 122, 1861 [CrossRef] [Google Scholar]
- Suess, K. A., Kriek, M., Price, S. H., & Barro, G. 2020, ApJ, 899, L26 [Google Scholar]
- Suess, K. A., Leja, J., Johnson, B. D., et al. 2022, ApJ, 935, 146 [NASA ADS] [CrossRef] [Google Scholar]
- Tacchella, S., Dekel, A., Carollo, C. M., et al. 2016, MNRAS, 458, 242 [NASA ADS] [CrossRef] [Google Scholar]
- Tacchella, S., Diemer, B., Hernquist, L., et al. 2019, MNRAS, 487, 5416 [Google Scholar]
- Tacchella, S., Conroy, C., Faber, S. M., et al. 2022, ApJ, 926, 134 [NASA ADS] [CrossRef] [Google Scholar]
- Tacconi, L. J., Neri, R., Genzel, R., et al. 2013, ApJ, 768, 74 [NASA ADS] [CrossRef] [Google Scholar]
- Tacconi, L. J., Genzel, R., Saintonge, A., et al. 2018, ApJ, 853, 179 [Google Scholar]
- Tacconi, L. J., Genzel, R., & Sternberg, A. 2020, ARA&A, 58, 157 [NASA ADS] [CrossRef] [Google Scholar]
- Terrazas, B. A., Bell, E. F., Woo, J., & Henriques, B. M. B. 2017, ApJ, 844, 170 [NASA ADS] [CrossRef] [Google Scholar]
- Tojeiro, R., Wilkins, S., Heavens, A. F., Panter, B., & Jimenez, R. 2009, ApJS, 185, 1 [NASA ADS] [CrossRef] [Google Scholar]
- Turner, C., Tacchella, S., D’Eugenio, F., et al. 2025, MNRAS, 537, 1826 [NASA ADS] [CrossRef] [Google Scholar]
- Urbano Stawinski, S. M., Cooper, M. C., Finkelstein, S. L., et al. 2024, MNRAS, 528, 5624 [Google Scholar]
- van der Wel, A., & Meidt, S. E. 2025, A&A, 704, A147 [NASA ADS] [CrossRef] [EDP Sciences] [Google Scholar]
- van der Wel, A., Franx, M., van Dokkum, P. G., et al. 2014, ApJ, 788, 28 [Google Scholar]
- van der Wel, A., Noeske, K., Bezanson, R., et al. 2016, ApJS, 223, 29 [Google Scholar]
- van der Wel, A., Bezanson, R., D’Eugenio, F., et al. 2021, ApJS, 256, 44 [NASA ADS] [CrossRef] [Google Scholar]
- van Dokkum, P. G., Whitaker, K. E., Brammer, G., et al. 2010, ApJ, 709, 1018 [Google Scholar]
- van Dokkum, P. G., Leja, J., Nelson, E. J., et al. 2013, ApJ, 771, L35 [NASA ADS] [CrossRef] [Google Scholar]
- van Dokkum, P. G., Nelson, E. J., Franx, M., et al. 2015, ApJ, 813, 23 [NASA ADS] [CrossRef] [Google Scholar]
- Vulcani, B., Bamford, S. P., Häußler, B., et al. 2014, MNRAS, 441, 1340 [NASA ADS] [CrossRef] [Google Scholar]
- Wan, J. T., Tacchella, S., D’Eugenio, F., Johnson, B. D., & van der Wel, A. 2025, MNRAS, 539, 2891 [Google Scholar]
- Webb, K., Balogh, M. L., Leja, J., et al. 2020, MNRAS, 498, 5317 [NASA ADS] [CrossRef] [Google Scholar]
- Weibel, A., de Graaff, A., Setton, D. J., et al. 2025, ApJ, 983, 11 [Google Scholar]
- Whitaker, K. E., van Dokkum, P. G., Brammer, G., & Franx, M. 2012, ApJ, 754, L29 [Google Scholar]
- Whitaker, K. E., Bezanson, R., van Dokkum, P. G., et al. 2017, ApJ, 838, 19 [NASA ADS] [CrossRef] [Google Scholar]
- Wild, V., Taj Aldeen, L., Carnall, A., et al. 2020, MNRAS, 494, 529 [NASA ADS] [CrossRef] [Google Scholar]
- Williams, R. J., Quadri, R. F., Franx, M., van Dokkum, P., & Labbé, I. 2009, ApJ, 691, 1879 [NASA ADS] [CrossRef] [Google Scholar]
- Williams, C. C., Giavalisco, M., Bezanson, R., et al. 2017, ApJ, 838, 94 [Google Scholar]
- Wu, P.-F., van der Wel, A., Bezanson, R., et al. 2018a, ApJ, 868, 37 [NASA ADS] [CrossRef] [Google Scholar]
- Wu, P.-F., van der Wel, A., Gallazzi, A., et al. 2018b, ApJ, 855, 85 [Google Scholar]
- Wu, P.-F., van der Wel, A., Bezanson, R., et al. 2020a, ApJ, 888, 77 [NASA ADS] [CrossRef] [Google Scholar]
- Wu, X., Davé, R., Tacchella, S., & Lotz, J. 2020b, MNRAS, 494, 5636 [Google Scholar]
- Wuyts, S., Labbé, I., Franx, M., et al. 2007, ApJ, 655, 51 [NASA ADS] [CrossRef] [Google Scholar]
- Yano, M., Kriek, M., van der Wel, A., & Whitaker, K. E. 2016, ApJ, 817, L21 [Google Scholar]
- Zhang, C., Peng, Y., Ho, L. C., et al. 2019, ApJ, 884, L52 [NASA ADS] [CrossRef] [Google Scholar]
- Zhang, Y., Setton, D. J., Price, S. H., et al. 2024, ApJ, 976, 36 [Google Scholar]
- Zhu, Q., Xu, D., Gaspari, M., et al. 2018, MNRAS, 480, L18 [CrossRef] [Google Scholar]
- Zibetti, S., & Gallazzi, A. R. 2022, MNRAS, 512, 1415 [NASA ADS] [CrossRef] [Google Scholar]
- Zibetti, S., Gallazzi, A. R., Ascasibar, Y., et al. 2017, MNRAS, 468, 1902 [NASA ADS] [Google Scholar]
- Zolotov, A., Dekel, A., Mandelker, N., et al. 2015, MNRAS, 450, 2327 [Google Scholar]
In fact, Suess et al. (2022) demonstrated that Prospector provides a very accurate reconstruction of PSB SFHs.
The formation redshift, zform, is defined as the redshift corresponding to a lookback time equal to the mass-weighted age (t★, mw)). We computed zform as: zform = z(tH(zobs)−t★, mw), where tH(zobs) is the age of the Universe at the galaxy’s spectroscopic redshift. This approach assumes that t★, mw closely traces the epoch of galaxy formation. Our estimated formation redshift values range from zform = 1–10.
Appendix A: Quenching boundaries
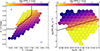 |
Fig. A.1. Distribution of the average D of our sample of 2908 galaxies in the UVJ (left) and SFR–M★ (right) planes. The average trends were derived with the locally weighted regression (LOESS) method (Cleveland & Devlin 1988; Cappellari et al. 2013). The black lines indicate the separation between star formation and quiescence in the UVJ diagram based on the definition of (Muzzin et al. 2013b), and in the SFR–M★ plane (sSFR = 10−11 yr−1). |
One of the main results of our study is based on the definition of the mass-doubling number, D, defined as
 (A.1)
(A.1)
and representing the number of times the stellar mass doubles within the age of the Universe at redshift z, at the current sSFR (Tacchella et al. 2022). Based on the sample and properties of their sample, massive quenching galaxies at a median redshift of z = 0.8, Tacchella et al. (2022) defined the quenching boundary to be between 1/20 < D(z) < 1/3 or −1.3 < log D(z) < − 0.48. Figure A.1, presents the UVJ and SFR–M★ planes color-coded with the doubling number D in log. Based on the average trends of D in the UVJ and SFR–M★ planes, the definition by Tacchella et al. (2022) seems to represent the LEGA-C galaxy sample well, and the cuts being meaningful. While small shifts in the boundary definitions could lead to variations in the measured τq, we tested alternative thresholds (keeping the width of the transition zone fixed) and found that the resulting differences in τq were typically around 0.15 Gyr. Therefore, the median quenching timescales remain largely unaffected, and we conclude that the adopted definition is appropriate for our analysis.
Appendix B: Validation with alternative models
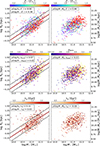 |
Fig. B.1. Scatter plots of the stellar population properties and quenching timescales of quiescent galaxies on the size–mass plane (left), and M★/Re vs. M★ (right). The panels from top to bottom display stellar metallicity (Z★), formation redshift (zform), and quenching timescale (τq). The solid red line is the best-fit size–mass relation for the quiescent population. The dashed black lines indicate the 1σ deviation from the best-fit relation. The stellar properties and quenching time were averaged using the LOESS method. Each hexbin contains at least five galaxies. In the top left corner of each panel we show the Spearman rank coefficients (ρ). |
Here we present the actual scatter plots of the stellar population properties and quenching timescales of quiescent galaxies on the size–mass plane, and M★/Re versus M★ (see Fig. B.1). From these scatter plots, we can reach the same conclusions as from the average trends presented in Fig. 7, especially for Z★ and zform. The scatter plot with τq is less prominent, and the LOESS method is necessary to recover the mean trends of the population.
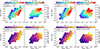 |
Fig. B.2. Mean stellar population properties of quiescent galaxies on the size–mass plane, and M★/Re vs. M★. The panels from top to bottom display stellar metallicity (Z★), and formation redshift (zform). The solid red line is the best-fit size–mass relation for the quiescent population. The dashed black lines indicate the 1σ deviation from the best-fit relation. The stellar properties and quenching time were averaged using the LOESS method. Each hexbin contains at least five galaxies. In the top left corner of each panel we show the Spearman rank coefficient (ρ). (Panel a) Stellar properties from Gallazzi et al. (2025a) derived with BaStA (Gallazzi et al. 2005; Zibetti et al. 2017) (Panel b) Stellar properties from Kaushal et al. (2024) derived with Bagpipes (Carnall et al. 2018) |
Moreover, within the LEGA-C team, we have applied three alternative methodologies to fit the LEGA-C DR3 spectra: Prospector (Nersesian et al. 2025, this work), BaStA (Gallazzi et al. 2025a) and Bagpipes (Kaushal et al. 2024). The BaStA code (Gallazzi et al. 2005; Zibetti et al. 2017; Zibetti & Gallazzi 2022) incorporates stochastic parametric SFHs and derives the stellar properties using Lick index and broadband photometry modeling. In Kaushal et al. (2024), we used the Bayesian SPS code Bagpipes for a spectrophotometric analysis, similar in scope to this work. The key differences are that Prospector employs a nonparametric SFH and marginalizes over emission lines, while Bagpipes uses parametric SFHs without line marginalization.
In Fig. B.2, we present the same trends shown in Fig. 7, but using the results from the two alternative SED fitting approaches. Despite differences in SED fitting methods, the overall trends with Z★ and zform remain consistent across all methods, confirming the robustness of our findings. The Spearman correlation coefficients also agree closely with those reported in Fig. 7. While some variation in absolute values is present, it is expected. Both BaStA and Bagpipes explore a broader metallicity range, allowing for higher Z★ values. Additionally, both rely on parametric SFHs, which tend to yield younger mass-weighted ages, and thus lower zform compared to the nonparametric SFHs used in Prospector, which is known to return older stellar ages (Leja et al. 2019b,a).
Appendix C: Comparing spectra of rapid-, fast-, and slow-quenching galaxies
In this section, we want to validate the quenching timescales (τq) inferred from the reconstructed SFHs using Prospector, based on the observed spectrophotometric data from the LEGA-C survey. To this end, we compare the observed and modeled spectra for a subset of galaxies selected based on their HδA absorption strength and size metric, Δlog(Re). Specifically, galaxies are divided into PSB and quiescent populations according to their HδA strength (see Sect. 2.4). The quiescent galaxies are further split into compact [Δlog(Re)≤ − 0.23] and extended [Δlog(Re)≥0.23]. Based on the Prospector-inferred quenching times, the median τq values for the PSBs, compact quiescent, and extended quiescent galaxies are 0.13, 0.8, and 1.5 Gyr, respectively (see also Fig. 8), corresponding to rapid-, fast-, and slow-quenching regimes. The median stellar mass across all three bins is comparable, at log M★/M⊙ = 11 ± 0.2.
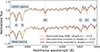 |
Fig. C.1. Median observed spectra of rapid- (yellow), fast- (red), and slow- (black) quenching galaxies. Galaxies are split by HδA strength into PSBs and quiescent. Furthermore, the quiescent galaxies are split based on their size metric, Δlog(Re), into small [Δlog(Re)≤ − 0.23] and large [Δlog(Re)≥0.23]. The spectra are smoothed, and normalized at 4000 Å for comparison, while the model spectra are shown with an arbitrary vertical offset for clarity. Several absorption features are marked with dotted lines. |
Figure C.1 presents the median, smoothed, and normalized spectra for the three galaxy groups. Clear differences are visible in key absorption features, including the Balmer lines (Hδ and Hγ), the Ca IIK+H lines, and the G-band (CH absorption around 4300 Å). The PSBs show the strongest Balmer absorption, characteristic of a young, recently quenched stellar population. Compact quiescent galaxies also display relatively strong Balmer lines, consistent with a more rapid quenching history compared to their extended counterparts. They also exhibit a more pronounced G-band feature, indicating an older and metal-rich underlying stellar population, consistent with the marginally higher zform and Z★ presented in Fig. 8.
Compact quiescent galaxies also show stronger Fe absorption lines, suggesting higher stellar metallicities, again in agreement with the trends shown in Fig. 8. In contrast, extended quiescent galaxies exhibit the weakest Balmer absorption, consistent with slow quenching. Their K feature strength is comparable to that of the compact group, suggesting similar intermediate-age stellar populations and supporting their similar formation redshifts. Interestingly, the G-band strength of extended quiescent galaxies is comparable to that of PSBs, potentially indicating residual star formation and a younger mass-weighted stellar age. Again, this is consistent with the slightly lower zform inferred in Fig. 8.
The spectral differences observed across the three galaxy groups, are consistent with the quenching timescales, metallicities, and formation redshifts presented in Fig. 8. This consistency supports the reliability of the Prospector-inferred SFHs and quenching times, validating the results of our analysis.
All Tables
All Figures
|
Fig. 1. SFR100Myr as a function of M★ for the LEGA-C galaxies at 0.6 ≤ zspec ≤ 1. Galaxies are color-coded by their UVJ diagram classification as UVJ star-forming (blue stars) and UVJ quiescent (red points) populations. Post-starburst galaxies are indicated as yellow squares. The magenta line indicates the SFS at z = 0.6 from Leja et al. (2022), and the dashed black line indicates the separation between star formation and quiescence (sSFR = 10−11 yr−1). The average uncertainties for the two main galaxy populations are shown in the bottom right corner in their respective colors. |
| In the text | |
|
Fig. 2. Galaxy size as a function of M★ for the LEGA-C galaxies at 0.6 ≤ zspec ≤ 1. Based on their sSFR, galaxies are separated into star-forming (blue stars) and quiescent (red points) populations. Post-starburst galaxies are indicated as yellow squares. For each galaxy population, we fitted a linear relation between the median sizes in each 0.1 dex mass bin and the stellar mass (gray symbols). To avoid the flattening of the relations at the low-mass end, we fit star-forming galaxies with log(M★/M⊙) ≥ 9.8 and quiescent galaxies with log(M★/M⊙) ≥ 10.3. |
| In the text | |
|
Fig. 3. Distribution of the galaxy size metric Δlog(Re), defined as the distance of the sizes Re from the median size–mass relation at a given mass, for each galaxy population. The blue histogram shows the relative size distribution for the star-forming galaxies, while the red histogram shows the relative size distribution for the quiescent galaxies. The corresponding solid curves are the best-fit Gaussian distributions. The statistics of the mean offset (μ) and variance (σ) of each Gaussian distribution is shown at the top left. |
| In the text | |
|
Fig. 4. Nonparametric SFHs of LEGA-C galaxies recovered with Prospector. The fitted SFR of each time bin is normalized by the total stellar mass formed up to that time bin. The SFHs are divided into the star-forming (blue) and quiescent (red) populations, based on their sSFR. In the background, we show the individual SFHs of our sample, while the thick lines and shaded areas denote the median and the 16th–84th percentile range for the star-forming (solid blue line and shaded blue area), quiescent (solid red line and shaded red area; excluding the 84 PSBs), and PSB (dashed yellow line and shaded yellow area) galaxies. The green shaded area displays the transition boundary from star-forming (dashed black line) to quiescence (solid black line). The coral point and square markers show the measurements of sSFR by Salmon et al. (2015) and Leja et al. (2022), respectively, at higher redshift. The dashed coral line shows the SFHs of lower-mass quiescent galaxies (10.5 ≤ log(M★/M⊙) < 11) from Tacchella et al. (2022). |
| In the text | |
|
Fig. 5. Median SFHs of LEGA-C galaxies separated into three stellar mass bins. From left to right: Median SFHs of the full primary galaxy sample, the star-forming population, and the quiescent population. The dotted violet line in the star-forming galaxies panel shows the SFH of high-mass star-forming galaxies from Tacchella et al. (2022). The dashed and dotted coral lines in the quiescent galaxies panel show the SFHs of lower-mass and higher-mass quiescent galaxies from Tacchella et al. (2022), respectively. The green shaded area displays the transition boundary from star-forming (dashed black line) to quiescence (solid black line). |
| In the text | |
|
Fig. 6. Median SFHs of LEGA-C galaxies separated into three stellar mass and three galaxy size bins: Δlog(Re)≤ − 0.23, −0.23 < Δlog(Re) < 0.23, and Δlog(Re)≥0.23. The SFHs are divided into the star-forming (blue) and quiescent (red) populations, based on their sSFR. The corresponding shaded regions denote the 16th–84th percentile range. The green shaded area displays the transition boundary from star-forming (dashed black line) to quiescence (solid black line). In the bottom left corner of each panel, we report the median ⟨τq⟩ from the individual SFHs in each bin (shown in black), along with the corresponding 16th–84th percentile range. |
| In the text | |
|
Fig. 7. Mean stellar population properties and quenching timescales of quiescent galaxies on the size–mass plane (left), and M★/Re vs. M★ (right). The panels (from top to bottom) display stellar metallicity (Z★), formation redshift (zform), and quenching timescale (τq). The solid red line is the best-fit size–mass relation for the quiescent population. The dashed black lines indicate the 1σ deviation from the best-fit relation. The stellar properties and quenching times were averaged using the LOESS method. Each hexbin contains at least five galaxies. In the top left corner of each panel we show the Spearman rank coefficients (ρ). |
| In the text | |
|
Fig. 8. Median quenching timescales as a function of stellar metallicity (top) and formation redshift (bottom) for the quiescent galaxy population. We separated the data into four size bins: Δlog(Re)≤ − 0.23, −0.23 < Δlog(Re) < 0, 0 < Δlog(Re) < 0.23, and Δlog(Re)≥0.23. The larger circles correspond to larger galaxies. The yellow square marks the median value measured for the PSB population. The error bars indicate the statistical uncertainty on the median ( |
| In the text | |
|
Fig. A.1. Distribution of the average D of our sample of 2908 galaxies in the UVJ (left) and SFR–M★ (right) planes. The average trends were derived with the locally weighted regression (LOESS) method (Cleveland & Devlin 1988; Cappellari et al. 2013). The black lines indicate the separation between star formation and quiescence in the UVJ diagram based on the definition of (Muzzin et al. 2013b), and in the SFR–M★ plane (sSFR = 10−11 yr−1). |
| In the text | |
|
Fig. B.1. Scatter plots of the stellar population properties and quenching timescales of quiescent galaxies on the size–mass plane (left), and M★/Re vs. M★ (right). The panels from top to bottom display stellar metallicity (Z★), formation redshift (zform), and quenching timescale (τq). The solid red line is the best-fit size–mass relation for the quiescent population. The dashed black lines indicate the 1σ deviation from the best-fit relation. The stellar properties and quenching time were averaged using the LOESS method. Each hexbin contains at least five galaxies. In the top left corner of each panel we show the Spearman rank coefficients (ρ). |
| In the text | |
|
Fig. B.2. Mean stellar population properties of quiescent galaxies on the size–mass plane, and M★/Re vs. M★. The panels from top to bottom display stellar metallicity (Z★), and formation redshift (zform). The solid red line is the best-fit size–mass relation for the quiescent population. The dashed black lines indicate the 1σ deviation from the best-fit relation. The stellar properties and quenching time were averaged using the LOESS method. Each hexbin contains at least five galaxies. In the top left corner of each panel we show the Spearman rank coefficient (ρ). (Panel a) Stellar properties from Gallazzi et al. (2025a) derived with BaStA (Gallazzi et al. 2005; Zibetti et al. 2017) (Panel b) Stellar properties from Kaushal et al. (2024) derived with Bagpipes (Carnall et al. 2018) |
| In the text | |
|
Fig. C.1. Median observed spectra of rapid- (yellow), fast- (red), and slow- (black) quenching galaxies. Galaxies are split by HδA strength into PSBs and quiescent. Furthermore, the quiescent galaxies are split based on their size metric, Δlog(Re), into small [Δlog(Re)≤ − 0.23] and large [Δlog(Re)≥0.23]. The spectra are smoothed, and normalized at 4000 Å for comparison, while the model spectra are shown with an arbitrary vertical offset for clarity. Several absorption features are marked with dotted lines. |
| In the text | |
Current usage metrics show cumulative count of Article Views (full-text article views including HTML views, PDF and ePub downloads, according to the available data) and Abstracts Views on Vision4Press platform.
Data correspond to usage on the plateform after 2015. The current usage metrics is available 48-96 hours after online publication and is updated daily on week days.
Initial download of the metrics may take a while.