Fig. 3.
Download original image
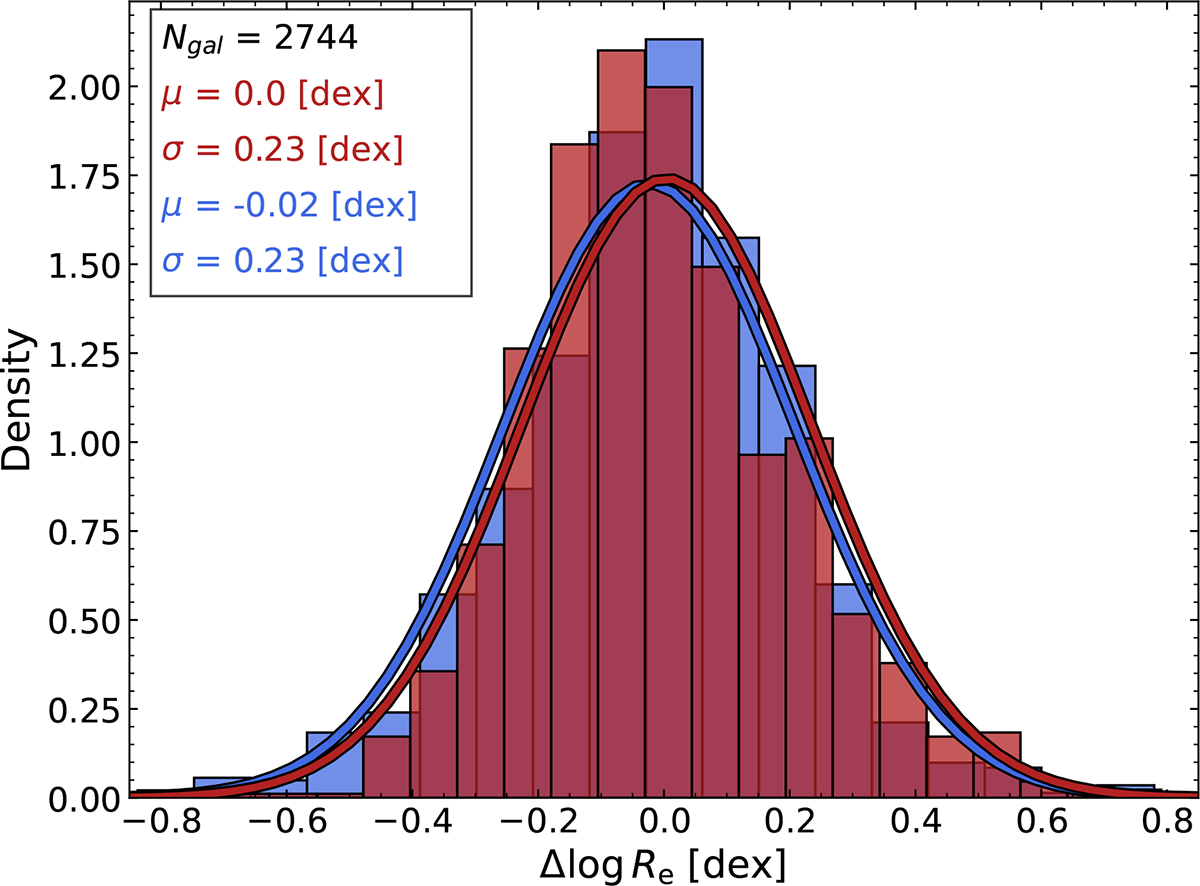
Distribution of the galaxy size metric Δlog(Re), defined as the distance of the sizes Re from the median size–mass relation at a given mass, for each galaxy population. The blue histogram shows the relative size distribution for the star-forming galaxies, while the red histogram shows the relative size distribution for the quiescent galaxies. The corresponding solid curves are the best-fit Gaussian distributions. The statistics of the mean offset (μ) and variance (σ) of each Gaussian distribution is shown at the top left.
Current usage metrics show cumulative count of Article Views (full-text article views including HTML views, PDF and ePub downloads, according to the available data) and Abstracts Views on Vision4Press platform.
Data correspond to usage on the plateform after 2015. The current usage metrics is available 48-96 hours after online publication and is updated daily on week days.
Initial download of the metrics may take a while.