| Issue |
A&A
Volume 705, January 2026
|
|
|---|---|---|
| Article Number | A21 | |
| Number of page(s) | 9 | |
| Section | The Sun and the Heliosphere | |
| DOI | https://doi.org/10.1051/0004-6361/202557295 | |
| Published online | 06 January 2026 | |
Solar cycle evolution of ICME sheath regions at 1 AU
1
Space Weather Group, University of Alcalá, Alcalá de Henares, Spain
2
Institute of Physics, University of Graz, Graz, Austria
3
Space and Atmospheric Electricity Group, Department of Meteorology, University of Reading, Reading, United Kingdom
★ Corresponding author: This email address is being protected from spambots. You need JavaScript enabled to view it.
Received:
17
September
2025
Accepted:
25
October
2025
Abstract
Aims. We investigate the evolution of interplanetary coronal mass ejection (ICME) sheath regions at 1 AU across solar cycles 23, 24, and the rising phase of 25, focusing on their variability and turbulence in relation to upstream solar wind conditions and the global heliospheric state.
Methods. Using a dataset of over 900 ICME sheath events, we applied statistical metrics such as the interquartile range (IQR) and the turbulence index (TI) to quantify variability and turbulence. The analysis compares full and rising phases of solar cycles and examines both local ICME parameters (e.g., sheath total pressure, non-radial flows) and global interplanetary indicators such as open solar flux (OSF).
Results. From solar cycle 23 to solar cycle 24, the sheath total pressure and magnetic field strength decreased by over 40% and 25%, respectively, accompanied by reduced turbulence and variability. In contrast, the rising phase of solar cycle 25 shows increased magnetic complexity, particularly in non-radial field components, despite stable bulk parameters. Non-radial flow patterns also shift from tangentially dominated in solar cycle 23 and solar cycle 24 to normal-dominated in solar cycle 25, suggesting changes in ICME orientation and sheath formation mechanisms. No significant correlation is found between OSF and sheath properties, indicating that local solar wind and ICME-specific factors are the primary drivers of sheath evolution.
Conclusions. The study reinforces the importance of upstream solar wind dynamics in relation to variations in plasma and magnetic field measured components of ICME sheaths. The derived trends in turbulence, magnetic orientation, and flow geometry suggest that sheath regions are sensitive indicators of solar cycle phase and should be considered as distinct, structured components in ICME modeling.
Key words: Sun: coronal mass ejections (CMEs) / Sun: heliosphere
© The Authors 2026
 Open Access article, published by EDP Sciences, under the terms of the Creative Commons Attribution License (https://creativecommons.org/licenses/by/4.0), which permits unrestricted use, distribution, and reproduction in any medium, provided the original work is properly cited.
This article is published in open access under the Subscribe to Open model. This email address is being protected from spambots. You need JavaScript enabled to view it. to support open access publication.
1. Introduction
Coronal mass ejections are solar eruptions of plasma and magnetic fields. The interplanetary counterparts of coronal mass ejections, known as ICMEs are detected from in situ measurements but also observed in heliospheric image data. Typically, we differentiate between three different parts within an ICME: (1) the shock, characterized as a sudden increase in all plasma and magnetic field parameters, (2) the sheath as a compressed plasma region with strongly fluctuating magnetic field and (3) the magnetic obstacle or flux rope identified by low density and temperature, along with smooth magnetic field variation and rotation (Burlaga et al. 1981; Klein & Burlaga 1982; Richardson & Cane 1995).
Compared to the flux rope, the sheath is typically denser and hotter, due to shock compression, and the magnetic field is typically more turbulent and variable (e.g., Kilpua et al. 2017; Luhmann et al. 2020). Although conditions at L1 are often assumed to represent those at Earth, recent observations indicate that CME sheath turbulence can evolve significantly even over this short distance (Argall et al. 2025). As part of the sheath region, situated directly upstream of the magnetic driver, a distinct non-expanding region of enhanced density is identified, presumably corresponding to piled-up plasma (Temmer & Bothmer 2022). Temmer et al. (2021) found a strong correlation between the sheath density and the upstream solar wind conditions, particularly the solar wind speed and density measured 24 hours before the arrival of the disturbance. Additionally, Salman et al. (2024) found that magnetic field fluctuations within ICME sheaths are strongly linked to the gradient in magnetic field strength between the upstream solar wind and the magnetic ejecta (ME). Hence, the upstream solar wind plays a major role in the development of the sheath and its characteristics.
The relative speed between the ICME and the local upstream solar wind is related to shock generation, whereas the expansion behavior of the ME influences the characteristics of the sheath structure (Salman et al. 2021). The magnetic field and speed of the ICME are also correlated as a result of the upstream solar wind compression in the sheath region (Owens et al. 2005). Distance-dependent relationships have been identified between the behavior of the ME and the properties of the sheath (Larrodera & Temmer 2024). During the evolution of the ICME, plasma accumulates along the radial direction of its expansion. However, the expansion and interaction between the solar wind and the interplanetary magnetic field (IMF) also generates non-radial flows (NRFs) within the sheath. Related with the NRFs, Owens & Cargill (2004) studied the plasma flows in the non-radial direction induced in the solar wind by the motion of ICMEs, which must arise as fast-moving ICMEs push solar wind plasma aside. Martinić et al. (2022, 2023) analyzed how the orientation of the ICME affects the NRF and how this relates to the draping of the IMF around the ICME. They found that high-inclined ICMEs have NRF > 1; therefore, the NRF is dominated by the tangential component producing a longitudinal draping. The relevance of the NRF is even more related with the sheath. Al-Haddad et al. (2022) analyzed the NRF through different ICMEs obtained from STEREO found that the sheaths are associated with the largest deflection flows. Jones et al. (2002) reported about possible effects from the shock orientation on the formation of planar magnetic structures in the sheath, which may facilitate the compression and amplification of magnetic fields in the sheath region. Such planar magnetic structures have been found to affect the geomagnetic effectiveness of ICME sheaths regions (Palmerio et al. 2016; Lugaz et al. 2016). They might also play an important role in particle acceleration processes.
The ICME rate is not constant and is related to the solar activity and therefore depends on the solar cycle phase. It should be also noted that the activity of each solar cycle is different. Solar cycle 24 (SC24) had much lower activity than the previous solar cycles, 21–23. Gopalswamy et al. (2015) showed that the magnetic obstacles during solar cycle 23 (SC23) had greater radial extents than in SC24. The increased ICME size may be explained by a drop of ∼50% in the sheath total pressure in the heliosphere reported for SC24 (see e.g., McComas et al. 2013). Differences in the expansion behavior directly influences the ability of ICMEs to drive shocks (Lugaz et al. 2017). In a recent study, Liu et al. (2025) compared active region areas and magnetic flux, finding a significant decrease during SC24. This highlights the strong connection between surface characteristics and ICME properties.
In that respect, the open solar magnetic flux (OSF) is a measure of the Sun’s magnetic field that extends outward into the heliosphere. The OSF connects solar surface structures to the IMF, and it therefore plays a crucial role in governing the structure of the heliosphere. Variations in the OSF are closely linked to the evolution of the photospheric magnetic field, which is traced, for example, by sunspots, as well as by CMEs that can carry the OSF away into the heliosphere (Fisk & Schwadron 2001). As the CME eruption is accompanied by a major restructuring of the coronal magnetic field, previously closed fields may be stretched out into interplanetary space or reconnect, and hence, contribute to the OSF. Owens & Crooker (2006) and Owens et al. (2011) proposed an OSF estimation method that includes both a constant component and a nonconstant component derived from the CME rate. This results in a sinusoidal evolution of the OSF in phase with the solar cycle. Indeed, Owens et al. (2011) highlighted that CMEs are a major source of open flux addition and can dominate the open flux budget during solar maximum. While the interactions between the ME (flux ropes) of CMEs and the OSF are well covered by studies, there are no studies that investigate the CME sheath region, which is most directly connected to the background solar wind, and the OSF.
This study focuses on the characteristics of ICME sheath regions in relation to upstream solar wind conditions and the overall state of the heliosphere. We place the sheath in the context of the ambient solar wind, examining how it reflects local and global heliospheric conditions. In particular, we analyze the OSF as a proxy for large-scale heliospheric structure and sheath total pressure, as well as sheath-specific features such as non-radial flows. While the OSF was initially considered a potential driver of sheath variability, our results show no significant correlation between OSF (excluding ICME contributions) and sheath properties. This indicates that sheath variability is primarily driven by local solar wind and ICME-specific factors. Consequently, our goal is to understand how sheath properties evolve across solar cycle phases. For this purpose, we used the extensive dataset provided by Larrodera & Temmer (2024) to conduct a detailed statistical and comparative analysis of these parameters over multiple solar cycles.
The structure of this article is organized as follows. Section 2 introduces the ICME sample used in this study, along with the statistical metrics applied throughout the analysis to ensure consistency and comparability. Section 3 describes the solar wind conditions preceding the ICME events, focusing on key variables such as the OSF and includes a statistical breakdown to highlight temporal variations. Section 4 characterizes the sheath regions associated with ICMEs by analyzing a set of physical parameters through statistical methods, aiming to identify patterns and anomalies across different solar cycles. Section 5 details the methodology employed to quantify turbulence within the sheath regions, emphasizing how these turbulent properties evolve over time and differ between solar cycles. Section 6 synthesizes the findings from the sheath analysis, interpreting their implications in the context of solar-terrestrial interactions and space weather forecasting. Finally, Section 7 summarizes the main conclusions drawn from the study, highlighting the contributions to our understanding of ICME dynamics and suggesting directions for future research.
2. ICME data and statistical methods
We selected ICMEs from Larrodera & Temmer (2024) covering the distance range between 0.95 AU and 1.05 AU for the time range 1994–2022. More precisely we used the sheath of these ICMEs understood as the region between the shock and the magnetic obstacle. Our event selection therefore focused on clear sheath onsets, which may exclude weaker ICMEs. In that regard we also would like to add that the measured local in situ signatures depend on whether the spacecraft crosses near the CME nose or flank, and on the background solar wind conditions. While the criterion of a clear sheath ensures a consistent identification of sheath boundaries, it may introduce a bias toward fast and apex-hit ICMEs, which is mitigated by having a large statistical sample.
The data availability spans two full solar cycles 23 (SC23; August 1996–December 2008; maximum November 2001) and 24 (SC24; December 2008–December 2019; maximum April 2014), as well as the rising phase of solar cycle 25 (SC25; start December 2019). We note that we discarded solar cycle 22 as only 12 ICME sheath events were detected during the available time range, 1994–1996. Table 1 shows the number of detected ICME sheaths from in situ measurements for each solar cycle at 1 AU. For a better comparison to solar cycle 25 (SC25), where only the rising phase is available, we performed a two-step analysis. In the first step we analyzed data using the full cycle sample (FCS) from SC23 and SC24. In the second step we analyzed data covering the rising phase sample (RPS) of SC23, SC24 and SC25 only. The rising phases of SC23 and SC24 are fully covered, while those from SC25 are only partly covered. Table 2 details the sheaths at 1AU for each rising phase.
Sheaths at 1 AU of the FCS.
Sheaths at 1 AU of the RPS.
The statistical results obtained from the solar cycle evolution analysis for OSF and ICME sheaths will be shown using boxplots. In the boxplots, the horizontal line represents the median value. The size of the box is defined by the interquartile range (IQR) Q3–Q1. The whiskers extend 1.5 times from the limits of the box, i.e., Q1 and Q3, beyond which lie the outliers, shown as additional dots. The IQR, as a measure of the central data spread, serves as a useful indicator of the sample’s statistical robust measure of variability. A low IQR suggests that the data are more clustered around the median, suggesting reduced dispersion. Given its robustness to outliers, the IQR provides a reliable and interpretable metric for assessing variability without being overly influenced by extreme values. The boxplots and the median values are presented in two different color combinations for FCS and RPS. The FCS is detailed with a blue box and a straight red line for the median. Meanwhile, the RPS is detailed with a black box and a straight orange line for the median.
3. Global heliospheric characteristic conditions
In this section, we analyze for FCS and RPS the global heliospheric conditions using the OSF. It can be understood as the magnetic flux threading the solar photosphere that extends in the heliosphere. We used a similar dataset to the one described in Frost et al. (2022) estimating the OSF at 1 AU from in situ measurements of ACE and WIND between 1994 and 2022. However, unlike Frost et al. (2022), in which ICMEs were not excluded, we removed ICME periods using the time ranges from the Richardson & Cane ICME list (Richardson & Cane 2024). Therefore, our OSF dataset only covers solar wind contributions. Figure 1 shows the distribution of the OSF for the different solar cycles using the FCS and separately for the RPS. The quartile values are given in Table 3. FCS shows between SC23 and SC24 a decrease in the median value of −31%. The IQR, understood as the data spread, decreases by −14% from SC23–SC24, highlighting less variability during SC24. RPS shows a very similar decrease of −34% from SC23 to SC24 followed by a smaller decrease of −12% from SC24 to SC25. On the other hand, the IQR shows almost no change from SC23 to SC24 with a small decrease of −16% from SC24 to SC25.
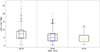 |
Fig. 1. OSF solar cycle boxplot. The FCS box is colored blue, with the median line in red and for the RPS the box is colored black, with the median line in orange. |
4. Sheath characteristic conditions
In this section we analyze for FCS and RPS the sheath characteristics by using different variables such as the sheath total pressure, non-radial flow speed and non-radial magnetic field. The values of each event are derived over the entire ICME sheath region.
4.1. Sheath total pressure (pT) and total magnetic field (B)
The sheath total pressure (pT) was obtained as the sum of the thermal (pTh = nkBT) and the magnetic pressure (pM = B2/2μ0), where T and B are the mean temperature and mean magnetic field amplitude of the sheath. In order to see which contribution is more relevant at 1 AU, we computed the pressure ratio, pTh/pM (plasma-beta), and found that around 85% of the time, pM dominates over pTh. A similar result for fast CMEs is derived in the statistical study from Masías-Meza et al. (2016).
Figure 2 and Table 4 show the sheath total pressure (pT) boxplot and its quartile values, respectively, for the FCS and the RPS. For the FCS, SC23 in comparison with SC24 shows a decrease of −42%. The IQR shows a decrease of −51% from SC23 to SC24, i.e., the sheath total pressure drops by half in SC24, as has been reported by previous studies. The RPS shows for the sheath total pressure, a decrease of −43% from SC23 to SC24, and an increase of +12% from SC24 to SC25. The IQR shows a large decrease from SC23 to SC24 of −57% and only a +6% increase from SC24 to SC25. The sheath total pressure in the rising phase of SC25 is comparable to SC24. Hence, compared to SC23 we observe in SC24 and SC25 low pressure and low fluctuations in the sheath.
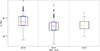 |
Fig. 2. pT solar cycle boxplot. The FCS box is colored blue, with the median line in red and for the RPS the box is colored black with the median line in orange. |
As was derived before, pT is dominated by pM; therefore, an increase or decrease in pT is due to an increase or decrease in B. Table 5 shows that the magnetic field magnitude does indeed follow the same trend as pT, but the percentages of change are smaller. For the FCS, the median magnetic field decreases from SC23 to SC24 by −26%, with a decrease in the data spread, i.e., IQR of −36%. In RPS, the magnetic field median decreases from SC23 to SC24 −28%. The IQR decreases from SC23 to SC24 by −42%. These results are aligned with those of previous authors; for example Gopalswamy et al. (2022) which shows SC24 as a weaker solar cycle with −32% less ICMEs and also less upstream solar wind pressure (−17%) and a smaller magnetic field (−14%). From SC24-SC25, the median magnetic field increases by +10%, similarly to the sheath total pressure (+12%). The only notable difference between the magnetic field magnitude and the sheath total pressure in its trends in RPS is a decrease in the IQR of the magnetic field from SC24 to SC25 (−10%), despite the +6% increase in sheath total pressure.
B solar cycle boxplots results.
4.2. Non-radial flows and magnetic field orientation
Within the sheath region, non-radial flows (NRFs) can distort the IMF, leading to a draping pattern around the leading edge of the flux rope (driver), rather than the IMF shaping the flow itself (Gosling & McComas 1987). This draping leads to the formation of NRFs within the sheath (Al-Haddad et al. 2022; Martinić et al. 2022). By analyzing NRFs, we can infer the orientation and configuration of the draped IMF. The NRFs will also be useful to analyze the different formation mechanism; for example, propagation or expansion, as is reported in Salman et al. (2021).
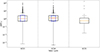 |
Fig. 3. Speed NRF solar cycle boxplot. The FCS box is colored blue with the median line in red and for the RPS the box is colored black with the median line in orange. |
For quantification, we decomposed the magnetic field and velocity using the RTN reference frame. NRF is defined as the absolute value of the ratio between the tangential and normal components of the speed, i.e., NRF = |vT/vN|. For the magnetic field, we defined the following ratios: NRBTN = |BT/BN|, NRBTR = |BT/BR|, and NRBNR = |BN/BR|. Figure 3 and Table 6 show the results for NRF. For the FCS, NRF increases by +14% from SC23 to SC24, indicating a stronger tangential component (vT) in SC24. The IQR decreases by approximately −36%, suggesting reduced variability. In the RPS, NRF increases by +24% from SC23 to SC24, followed by a −57% decrease in SC24–SC25. In SC23, the tangential and normal speed components differ by 15% (NRF = 1.15), while in SC24, the tangential component becomes more dominant (NRF = 1.43, a 40% increase). In SC25, the normal component dominates by about 60% (NRF = 0.61). The IQR remains similar between SC23–SC24 (+2% difference) but drops by −50% in SC24–SC25, indicating reduced variations.
The results for NRBTN are presented in Figure 4 and quantified in Table 7. It should be noted that the median values of FCS and RPS are NRBTN > 1, i.e., BT > BN, the tangential component is more relevant than the normal component in all the cases. For the FCS, there is a small +6% increase from SC23 to SC24. The data spread increases +13% from SC23 to SC24 showing that in this case, SC24 show less dispersion than SC23. For the RPS, we find a +11% increase from SC23 to SC24 followed by a small −9% decrease from SC24 to SC25. In both cases NRBTN > 1, so the tangential component is more relevant, being even more important in the rising phase of SC24. The data spread shows an increase of +9% from SC23 to SC24 and +36% from SC24 to SC25, i.e., the dispersion of the rising phases increases. These results show, as we already see in NRF, that in general, the tangential component is more relevant than the normal component. The only exception is for the rising phase of SC25, where it is the opposite.
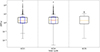 |
Fig. 4. NRBTN solar cycle boxplot. The FCS box is colored blue with the median line in red and for the RPS the box is colored black with the median line in orange. |
As was previously mentioned, we also computed changes in the magnetic field direction, which we refer to as the non-radial orientation of the magnetic field, NRBNR and NRBTR. Table 8 presents these quartile values. In the FCS, both NRBTR and NRBNR increase from SC23 to SC24 by +6% and +9%, respectively. Since NRBNR < 1, BN remains smaller than BR, although the difference narrows in SC24. Conversely, BT is consistently larger than BR. In the RPS, both components show an upward trend: NRBTR remains stable from SC23–SC24 and SC24–SC25 and increases by +4% from SC24 to SC25, while NRBNR increases by +8% and 21% over the same intervals. Given that sheaths are embedded in the solar wind, their development shapes the draping characteristics, which hence are influenced by the IMF. Therefore, we also analyzed the non-radial orientation of the magnetic field in the upstream solar wind. Tables 9 and 10 summarize these results, with the “Window size” column indicating the duration of the upstream region considered. In the FCS, NRBTR increases from the upstream solar wind to the sheath, regardless of whether a 1 hour or 2 hour window is used. During SC23, BT is 75% greater than BR in the sheath, while in the upstream solar wind this difference ranges from 6% to 11%. Combined with the increase in NRBNR, indicating a stronger contribution from BN, these results suggest that IMF draping is significant during SC23. The same reasoning applies to SC24, where both NRBNR and NRBTR are higher, indicating more intense draping. Although NRBNR < 1, the increasing trend highlights its growing relevance. In the RPS, a similar pattern is observed: for all three rising phases, NRBTR values are lower in the upstream solar wind and increase in the sheath. The same trend is seen in NRBNR, which even exceeds 1 during the rising phase of SC25, indicating a stronger non-radial contribution from BN.
NRBTR solar cycle boxplots results of the upstream solar wind.
NRBNR solar cycle boxplots results of the upstream solar wind.
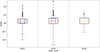 |
Fig. 5. NRBTR solar cycle boxplot. The FCS box is colored blue with the median line in red and for the RPS the box is colored black with the median line in orange. |
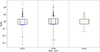 |
Fig. 6. NRBNR solar cycle boxplot. The FCS box is colored blue with the median line in red and for the RPS the box is colored black with the median line in orange. |
5. Quantifying sheath turbulence using TI
The turbulence index (TI), defined as the ratio between the IQR and the median (Q2), TI = IQR/Q2, offers a relative measure of turbulence within a dataset. Unlike absolute dispersion metrics, TI contextualizes the spread of the data in relation to its median value, making it particularly useful for comparing variations across variables with different scales. A lower TI indicates that the turbulence is small relative to the median, suggesting a lower number of variations in the system. As a robust and dimensionless indicator, TI complements traditional dispersion measures as the IQR, by highlighting proportional changes in data structure that might otherwise go unnoticed.
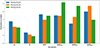 |
Fig. 7. Turbulence index (TI) for the RPS of the total pressure (pT), NRF speed (NRF), magnetic field magnitude (B) and non-radial magnetic field (NRBTN, NRBTR and NRBNR). The blue, orange and green bars shows the TI values for the rising phase of SC23, SC24 and SC25 respectively. |
5.1. RPS results
Table 11 details the RPS–TI of the different sheath characteristic variables analyzed: the sheath total pressure (pT), magnetic field magnitude (B), NRF speed (NRF) and non-radial magnetic field (NRBTN, NRBTR and NRBNR). All of these have been obtained for the entire sheath region through the median (Q2) and the IQR, as was explained before. Complementarily, Figure 7 shows these same results but with blue, orange and green bars for the RPS of SC23, SC24 and SC25 respectively, showing the TI values obtained for each variable.
The sheath total pressure shows a constant decrease in TI from SC23 to SC25, being more pronounced from SC23 to SC24. This suggests that over the solar cycles the sheath fluctuations progressively become lower. Since pT is primarily governed by the magnetic field, this trend likely reflects a reduction in magnetic field fluctuations within the sheath. Indeed, from Table 11, TI–B has the same trend as pT, but in this case the level of fluctuations is smaller. Actually, B shows the lowest TI of all the variables under study. These results reinforce the idea obtained from pT that the fluctuation in RPS is reduced from SC23–SC25. The previous section showed that in both cases, the data from pT and B were less spread around the median in the rising phases of SC23 and SC24. This result complements the fact of fewer fluctuations in both rising phases. In the rising phase of SC25, B also reduces the spread but in pT shows a small increase.
On the other hand, all the NRFs studied have higher TI than pT and B. NRF shows a decrease from the rising phase SC23–SC24 followed by almost the same increase in SC25. This reflects the less turbulent rising SC24 phase and it is aligned with what we observed in previous results, i.e., SC24 is the solar cycle with less variability. The non-radial orientation in the magnetic field show different trends. NRBTN and NRBTR, both related with the tangential component show that the highest TI is for the rising phase of SC25. Meanwhile, the highest turbulence of NRBNR is for the rising phase of SC24.
5.2. FCS results
The FCS-TI values obtained from the different variables analyzed are detailed in Table 12. Meanwhile Figure 8 shows these TI values for each variable with blue and orange bars for SC23 and SC24 respectively.
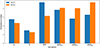 |
Fig. 8. Turbulence index (TI) for the FCS of the total pressure (pT), NRF speed (NRF), magnetic field magnitude (B), and non-radial magnetic field (NRBTN, NRBTR, and NRBNR). The blue and orange bars shows the TI values for the entire solar cycles 23 and 24, respectively. |
SC24 continues to exhibit lower turbulence levels in pT and B, consistent with the results obtained from the RPS analysis. This supports the characterization of SC24 as a less intense solar cycle. pT follows the same trend observed in the rising phase, i.e., a decrease in turbulence from SC23 to SC24. This complements the reduced data spread also observed for SC24 through the IQR in the previous section. As occurred in the FCS, the B turbulence also decreases from SC23 to SC24, although it is smaller than the turbulence of pT. In this case, as occurred for the sheath total pressure, the magnetic field magnitude in SC24 has fewer fluctuations than SC23.
The TI-FCS NRF show different trends. On the one hand, for NRF, SC23 is more turbulent than SC24. On the other hand, all the magnetic field NRFs show the opposite. SC24 is more turbulent than SC23. This indicates that even though SC24 was less active overall, the magnetic field turbulences within sheaths became more pronounced. These results collectively suggest that while bulk plasma properties became more homogeneous, the magnetic field configuration within sheaths evolved toward greater complexity. This divergence may reflect changes in magnetic topology or upstream solar wind conditions that disproportionately affect magnetic field behavior.
6. Discussion
The sheaths driven by ICMEs are the first structures to interact with Earth’s magnetosphere and can cause, especially due to strong fluctuations in the magnetic field, geomagnetic storms independent of the ME (Pulkkinen et al. 2007; Myllys et al. 2016). To better understand the characteristics of ICME sheath regions, we performed a statistical study and cross-compared events during solar cycles 23–25 (SC23–25) in two samples. The first sample involves ICMEs from the full solar cycles (FCS), i.e., SC23 and SC24. The second sample, to account for the missing decline phase in SC25, involves only ICMEs from the rising phases (RPSs) of SC23, SC24, and SC25. To describe the sheath characteristics, we derived the sheath total pressure (pT), NRF speed (NRF), and non-radial magnetic field (NRBTN, NRBTR, and NRBNR). For each sample we calculated the interquartile range IQR to quantify the overall variability of the variables and the TI which is a measure of the fluctuations scaled by the median value. To describe the solar wind environment in which the ICMEs travel, and to see how the overall heliospheric magnetic conditions might affect the sheath regions, we used the upstream magnetic field and the measured OSF in interplanetary space.
6.1. Relation to heliospheric conditions
We find that the sheath total pressure, sheath median magnetic field, and the median OSF – excluding the ICME contribution – decrease in both the RPS and FCS samples over the solar cycles (see Section 3). Although these trends suggest a possible physical connection between the parameters, the Spearman correlation coefficients between the OSF and the extracted sheath variables show no significant correlation. Therefore, while ICMEs are found to make a substantial contribution to the OSF and can nearly double it from solar minimum to maximum (Owens et al. 2011), our results indicate that the OSF is not directly related to the sheath properties. The Spearman correlation coefficient calculated between the average sheath magnetic field and the 1 hour (2 hours) upstream magnetic field is around 0.50 in both cases RPS and FCS, showing a moderate correlation. This agrees with the findings of Salman et al. (2024), who reported a strong correlation (0.76) between the upstream magnetic field fluctuations and the ratio of the magnetic field strength in the ME to that in the upstream solar wind (SW), BME/BSW (see also Temmer et al. 2021). By extending the analysis to all other extracted variables and their possible combinations, we found no significant correlations, indicating an absence of meaningful relationships among the variables examined.
6.2. Solar cycle variations – amplitudes
The comparative analysis of the sheath-related variables across the solar cycles is summarized in Table 13. These results reveal a clear transition from SC23 to SC24, characterized by a significant decrease in both pT (around ∼40%) and B (around ∼25%), accompanied by reduced variability and turbulence. This trend is consistent across both FCS and RPS, supporting the interpretation of SC24 as a period of enhanced sheath stability and reduced heliospheric activity. The TI analysis further confirms this, showing lower turbulence levels in SC24 for most parameters. The RPS for SC24 shows a thermal pressure contribution of 36% against 29% for the RPS of SC23. Between SC24 and SC25 the thermal pressure might make a higher contribution to the sheath total pressure. These results are supported by previous studies finding a reduced magnetic field magnitude within ICME’s ME and sheaths (Gopalswamy et al. 2014; Yermolaev et al. 2021; Gopalswamy et al. 2022) as well as a reduced number of observed ICMEs during SC24 (Yermolaev et al. 2022).
Summary of percentage changes in median, IQR, and TI for sheath-related variables across solar cycles.
The solar cycle related analysis for the global heliospheric condition using the OSF (see Table 14) shows similar trends. For the FCS, the median OSF decreases by 30% from SC23 to SC24 with a reduction in the data spread around the median by 14%. In the RPS, the OSF reveals a strong decrease (−34%) in the median value for the rising phases from SC23–SC24, followed by a weaker one (−12%) from SC24–SC25. The data spread shows no change from SC23–SC24 with a decrease from SC24–SC25 of −16%. This indicates that a reduction in the OSF is accompanied by a decrease in its complexity, except for the RPS of SC23 and SC24, where there was no change in spread.
Summary of percentage changes in median, IQR for global solar wind-related variables across solar cycles.
6.3. Solar cycle variations – non-radial flows and magnetic field orientation
For the FCS from SC23 to SC24 we find an increase in the NRF, and hence an enhancement in the contribution of vT. This is accompanied by a decrease in the data spread and TI. The non-radial magnetic field (NRBTN, NRBTR, and NRBNR) behavior is different. While the median values increase too, they do so by a smaller amount than for the NRF. However, data spread and TI show enhancements. Concluding, compared to SC23, for SC24 the non-radial plasma flow behavior is less turbulent, while the non-radial behavior of the magnetic field turns out to be more turbulent. For the RPS there is a change in NRF relevance, from the dominant component, vT, in SC23 and SC24, to vN in SC25 accompanied by higher turbulence (see Table 6). The non-radial magnetic field ratio, BT/BN, reveals a dominance of BT for all cycles and rising phases (see Table 7). BN/BR shows a dominance of BR over all cycles and rising phases except for SC25 during which BN dominates. The tangential component shows over the radial component a dominance over all cycles and rising phases (see Table 8).
The ICME inclination is related to the NRF and will also affect how the IMF drapes. Our results (see Table 6) show that for both cases, FCS and RPS, the derived NRF median value is greater than 1 except for rising phase of SC25. Martinić et al. (2022) give for high-inclined ICMEs a mean NRF of 1.50 ± 0.60, and for low-inclined ICMEs a mean NRF of 0.98 ± 0.37. Considering the mean value and one standard deviation, an overlap between the two regimes can be argued to be in the range of 0.89 and 1.35. Consequently, the NRF values obtained in our research reveal that only the rising phases of SC24 and SC25 are outside this overlap and can be classified as high- and low-inclination ICMEs, respectively. All other events occur within this interval near the upper boundary, and therefore tend to be classified as highly inclined ICMEs.
6.4. Relation to local upstream conditions
The relationship between the upstream and sheath magnetic fields is of particular relevance. For both non-radial magnetic field ratios, NRBTR and NRBNR, we observe an enhancement from upstream to sheath part. NRBTR is found in all cycles and phases to be significantly larger than one, hinting at the influence on the tangential magnetic field component in the sheath formation. This might be expected due to the Parker spiral which is reflected in the dominance of BT over BR. NRBNR has values much lower than one for all cycles and phases, with a slight increase from upstream to the sheath part. Hence, we might see the intensification of the normal component reflecting the compression process in the sheath, adding out-of-ecliptic components to the magnetic field. This is found to be exceptionally striking for SC25, where the sheath NRBNR even has a value larger than one. Combined with the finding that the rising phase of SC25 presumably includes more low-inclination ICMEs, the compression may be more efficient in such a geometry, as the plasma can less easily flow around the extended ICME body.
A rise in NRBTR from upstream to the sheath may indicate solar wind deflection at the nose of the ICME. Similarly, an increase in NRBNR from the upstream region to the sheath can be interpreted as a proxy for compression and enhanced plasma pile-up. Both effects are consistent with the sheath formation mechanisms proposed by Salman et al. (2021), who suggested (i) a propagation mechanism, in which the solar wind is deflected around the nose of the magnetic obstacle, and (ii) an expansion mechanism, in which the obstacle expands without significant propagation, leading to plasma accumulation ahead of it. In that respect, our results suggest a trend toward a dominance in the propagation sheath formation mechanism. An exception occurs for the rising phase of SC25 where the normal component clearly dominates referring to an effect of expansion. This aligns with the findings of Larrodera & Temmer (2024), who, using a different approach, showed that expansion becomes dominant only in the outer heliosphere, whereas up to 1 AU both propagation and expansion contribute.
6.5. Limitations
We emphasize that our analysis interprets NRFs within the framework of classical ICME structures, typically represented by a croissant-shaped flux rope expanding self-similarly through interplanetary space (e.g., Zurbuchen & Richardson 2006; Thernisien et al. 2009; Wang et al. 2018). However, many ICMEs deviate from this idealized geometry due to interactions with the ambient solar wind, which can modify the observed magnetic field pile-up and NRFs depending on the relative orientation and local conditions. Recent modeling studies (e.g., Rodriguez et al. 2024; Wyper et al. 2024) indicate that spheromak-like or pseudostreamer-associated CMEs may be relatively common, particularly during weaker solar cycles. Such alternative configurations, together with possible magnetic reconnection between the ejecta and the ambient IMF, introduce additional complexity that can influence the observed flow patterns and magnetic field orientations. While our statistical results reveal consistent trends across solar cycles, this structural diversity should be considered when interpreting individual events or when comparing different heliospheric conditions.
Finally, it should be noted that the characterization of sheath onsets and ICME structures is inherently influenced by the spacecraft’s position relative to the ICME and the ambient solar wind. The local in situ signatures, used to extract well-observed ICMEs with sheath regions, reflect on whether the spacecraft crosses near the CME nose or flank, and on the background solar wind conditions. Consequently, apparent differences in sheath onset sharpness, compression, or turbulence may partly reflect variations in sampling geometry rather than intrinsic physical differences between events. This observational bias is a well-known limitation of single-point measurements (e.g., Kilpua et al. 2019) and should be considered when interpreting our statistical trends and inter-cycle comparisons.
7. Conclusions
In this study, we place the ICME sheath region of more than 900 events in the context of the ambient solar wind, examining how sheath characteristics reflects local and global heliospheric solar wind conditions, and how they change over various solar cycles (SC23–SC25). Our main findings for strong ICMEs driving distinct sheath regions are:
-
There is no significant correlation found between OSF and sheath properties, suggesting that the sheath is not directly governed by large-scale heliospheric magnetic flux.
-
A moderate correlation is derived between the sheath’s average total magnetic field and the upstream magnetic field (1 hour and 2 hours ahead), indicating that local upstream conditions do exert a measurable influence on the magnetic field strength within the sheath.
-
Compared to SC23 and 25, the weak SC24 leads to a significant decrease in the sheath’s pT and B, as well as OSF, accompanied by a generally reduced variability and turbulence in that variables.
-
BN increases in dominance moving from upstream into the sheath; most striking for SC25, presumably covering more low-inclination ICMEs, where compression can be achieved more effectively.
-
A transition from tangentially dominated plasma flows in SC23 and SC24 to more normal-oriented flows in SC25 may reflect changes in ICME orientation, which in turn seem to influence the degree of magnetic turbulence and complexity within the sheath.
-
Up to 1 AU both propagation and expansion mechanisms contribute to sheath formation with a dominance in expansion found for the rising phase of SC25.
This work reinforces the importance of ICME sheath regions as dynamic and evolving structures that respond greatly to local solar wind conditions. The observed trends underscore the need to treat sheath evolution as a distinct process, with implications for space weather forecasting and heliospheric modeling. We note though that apparent differences in sheath onset, compression, or turbulence may partly reflect variations in sampling geometry rather than intrinsic physical differences between events. While our statistical approach mitigates this by aggregating a large number of events, future multi-spacecraft missions such as Solar Orbiter and Parker Solar Probe will be essential to resolve the full three-dimensional structure and evolution of sheath regions.
Acknowledgments
We would like to thank the anonymous referee for constructive comments that helped to improve that work. C.L. acknowledge the support by project PID2024-162117OB-I00 funded by MICIU/AEI/10.13039/501100011033/FEDER, UE. M.O. was part-funded by Science and Technology Facilities Council (STFC) grant number UKRI1207 and Natural Environment Research Council (NERC) grant number NE/Y001052/1.
References
- Al-Haddad, N., Galvin, A. B., Lugaz, N., Farrugia, C. J., & Yu, W. 2022, ApJ, 927, 68 [NASA ADS] [CrossRef] [Google Scholar]
- Argall, M. R., Chen, L.-J., Lugaz, N., et al. 2025, ApJ, submitted [arXiv:2505.13645] [Google Scholar]
- Burlaga, L. F., Hundhausen, A. J., & Zhao, X. P. 1981, JGR, 86, 8893 [Google Scholar]
- Fisk, L. A., & Schwadron, N. A. 2001, ApJ, 560, 425 [Google Scholar]
- Frost, A. M., Owens, M., Macneil, A., & Lockwood, M. 2022, SoPh, 297, 82 [Google Scholar]
- Gopalswamy, N., Akiyama, S., Yashiro, S., et al. 2014, GRL, 41, 2673 [Google Scholar]
- Gopalswamy, N., Yashiro, S., Xie, H., Akiyama, S., & Mäkelä, P. 2015, JGR, 120, 9221 [Google Scholar]
- Gopalswamy, N., Mäkelä, P., Yashiro, S., Akiyama, S., & Xie, H. 2022, J. Phys. Conf. Ser., 2214, 012021 [Google Scholar]
- Gosling, J. T., & McComas, D. J. 1987, GRL, 14, 355 [Google Scholar]
- Jones, G. H., Rees, A., Balogh, A., & Forsyth, R. J. 2002, GRL, 29, 1520 [Google Scholar]
- Kilpua, E., Koskinen, H. E. J., & Pulkkinen, T. I. 2017, Liv. Rev. SoPh, 14, 5 [Google Scholar]
- Kilpua, E. K. J., Fontaine, D., Moissard, C., et al. 2019, SpW, 17, 1257 [Google Scholar]
- Klein, L. W., & Burlaga, L. F. 1982, JGR, 87, 613 [Google Scholar]
- Larrodera, C., & Temmer, M. 2024, A&A, 685, A89 [CrossRef] [EDP Sciences] [Google Scholar]
- Liu, Y., Xu, T., Wan, M., et al. 2025, ApJS, 278, 48 [Google Scholar]
- Lugaz, N., Farrugia, C. J., Winslow, R. M., et al. 2016, JGR, 121, 861 [Google Scholar]
- Lugaz, N., Farrugia, C. J., Winslow, R. M., et al. 2017, ApJ, 848, 75 [Google Scholar]
- Luhmann, J. G., Gopalswamy, N., Jian, L. K., & Lugaz, N. 2020, SoPh, 295, 61 [Google Scholar]
- Martinić, K., Dumbović, M., Temmer, M., Veronig, A., & Vršnak, B. 2022, A&A, 661, A155 [NASA ADS] [CrossRef] [EDP Sciences] [Google Scholar]
- Martinić, K., Dumbović, M., Čalogović, J., et al. 2023, A&A, 679, A97 [NASA ADS] [CrossRef] [EDP Sciences] [Google Scholar]
- Masías-Meza, J. J., Dasso, S., Démoulin, P., Rodriguez, L., & Janvier, M. 2016, A&A, 592, A118 [NASA ADS] [CrossRef] [EDP Sciences] [Google Scholar]
- McComas, D. J., Angold, N., Elliott, H. A., et al. 2013, ApJ, 779, 2 [Google Scholar]
- Myllys, M., Kilpua, E. K. J., Lavraud, B., & Pulkkinen, T. I. 2016, JGR, 121, 4378 [Google Scholar]
- Owens, M., & Cargill, P. 2004, A. Geo., 22, 4397 [Google Scholar]
- Owens, M. J., & Crooker, N. U. 2006, JGR, 111, A10104 [Google Scholar]
- Owens, M. J., Cargill, P. J., Pagel, C., Siscoe, G. L., & Crooker, N. U. 2005, JGR, 110, A01105 [Google Scholar]
- Owens, M. J., Crooker, N. U., & Lockwood, M. 2011, JGR, 116, A04111 [Google Scholar]
- Palmerio, E., Kilpua, E. K. J., & Savani, N. P. 2016, A. Geo., 34, 313 [Google Scholar]
- Pulkkinen, T. I., Partamies, N., Huttunen, K. E. J., Reeves, G. D., & Koskinen, H. E. J. 2007, GRL, 34, L02105 [Google Scholar]
- Richardson, I. G., & Cane, H. V. 1995, JGR, 100, 23397 [Google Scholar]
- Richardson, I., & Cane, H. 2024, Harvard Dataverse [Google Scholar]
- Rodriguez, L., Shukhobodskaia, D., Niemela, A., et al. 2024, A&A, 689, A187 [NASA ADS] [CrossRef] [EDP Sciences] [Google Scholar]
- Salman, T. M., Lugaz, N., Winslow, R. M., et al. 2021, ApJ, 921, 57 [NASA ADS] [CrossRef] [Google Scholar]
- Salman, T. M., Nieves-Chinchilla, T., Jian, L. K., et al. 2024, ApJ, 966, 118 [NASA ADS] [CrossRef] [Google Scholar]
- Temmer, M., & Bothmer, V. 2022, A&A, 665, A70 [NASA ADS] [CrossRef] [EDP Sciences] [Google Scholar]
- Temmer, M., Holzknecht, L., Dumbović, M., et al. 2021, JGR, 126, e28380 [Google Scholar]
- Thernisien, A., Vourlidas, A., & Howard, R. A. 2009, SoPh, 256, 111 [Google Scholar]
- Wang, Y., Shen, C., Liu, R., et al. 2018, JGR, 123, 3238 [Google Scholar]
- Wyper, P. F., Lynch, B. J., DeVore, C. R., et al. 2024, ApJ, 975, 168 [Google Scholar]
- Yermolaev, Y. I., Lodkina, I. G., Khokhlachev, A. A., et al. 2021, JGR, 126, e29618 [Google Scholar]
- Yermolaev, Y. I., Lodkina, I. G., Khokhlachev, A. A., & Yermolaev, M. Y. 2022, Universe, 8, 495 [Google Scholar]
- Zurbuchen, T. H., & Richardson, I. G. 2006, SSR, 123, 31 [Google Scholar]
All Tables
Summary of percentage changes in median, IQR, and TI for sheath-related variables across solar cycles.
Summary of percentage changes in median, IQR for global solar wind-related variables across solar cycles.
All Figures
|
Fig. 1. OSF solar cycle boxplot. The FCS box is colored blue, with the median line in red and for the RPS the box is colored black, with the median line in orange. |
| In the text | |
|
Fig. 2. pT solar cycle boxplot. The FCS box is colored blue, with the median line in red and for the RPS the box is colored black with the median line in orange. |
| In the text | |
|
Fig. 3. Speed NRF solar cycle boxplot. The FCS box is colored blue with the median line in red and for the RPS the box is colored black with the median line in orange. |
| In the text | |
|
Fig. 4. NRBTN solar cycle boxplot. The FCS box is colored blue with the median line in red and for the RPS the box is colored black with the median line in orange. |
| In the text | |
|
Fig. 5. NRBTR solar cycle boxplot. The FCS box is colored blue with the median line in red and for the RPS the box is colored black with the median line in orange. |
| In the text | |
|
Fig. 6. NRBNR solar cycle boxplot. The FCS box is colored blue with the median line in red and for the RPS the box is colored black with the median line in orange. |
| In the text | |
|
Fig. 7. Turbulence index (TI) for the RPS of the total pressure (pT), NRF speed (NRF), magnetic field magnitude (B) and non-radial magnetic field (NRBTN, NRBTR and NRBNR). The blue, orange and green bars shows the TI values for the rising phase of SC23, SC24 and SC25 respectively. |
| In the text | |
|
Fig. 8. Turbulence index (TI) for the FCS of the total pressure (pT), NRF speed (NRF), magnetic field magnitude (B), and non-radial magnetic field (NRBTN, NRBTR, and NRBNR). The blue and orange bars shows the TI values for the entire solar cycles 23 and 24, respectively. |
| In the text | |
Current usage metrics show cumulative count of Article Views (full-text article views including HTML views, PDF and ePub downloads, according to the available data) and Abstracts Views on Vision4Press platform.
Data correspond to usage on the plateform after 2015. The current usage metrics is available 48-96 hours after online publication and is updated daily on week days.
Initial download of the metrics may take a while.