Fig. 10
Download original image
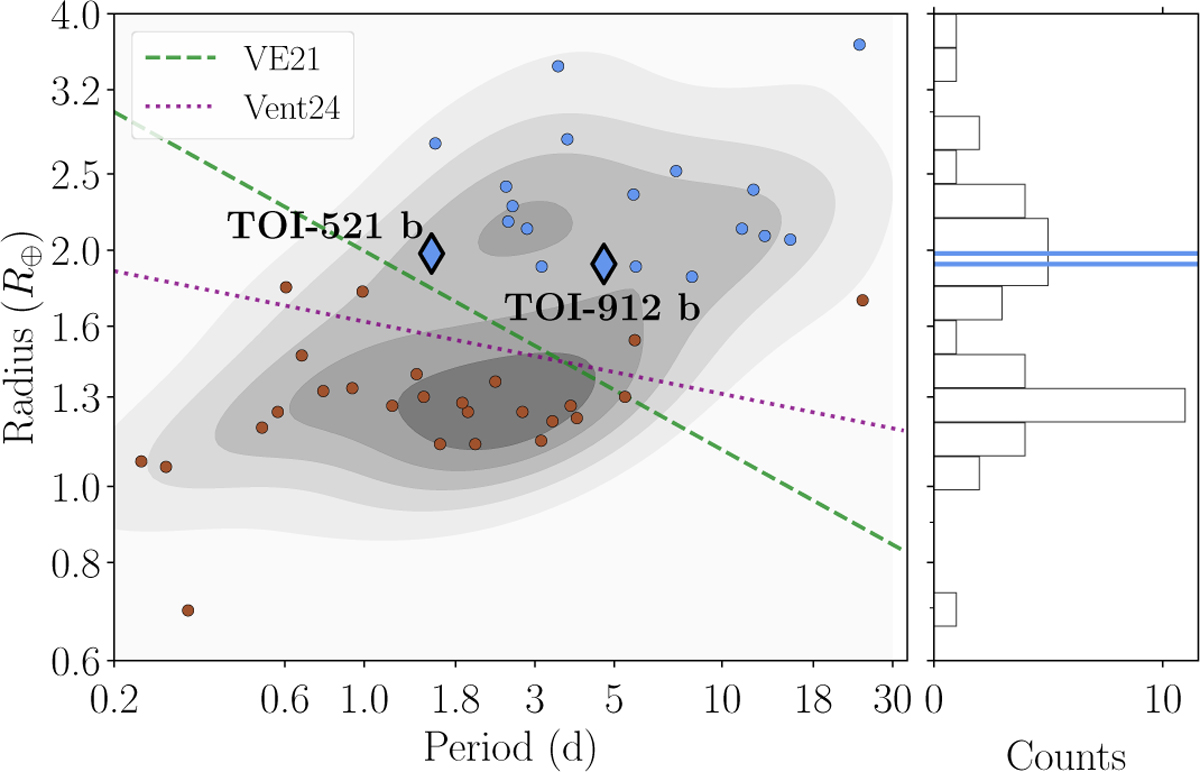
Period-radius diagram of the M-dwarf population of sub-Neptunes, using the same sample as in Fig. 8. Planets are colour-coded according to their density, as in Fig. 9. The green-dashed and purple-dotted lines mark the position of the radius gap for M dwarfs estimated by Van Eylen et al. (2021) and Venturini et al. (2024), respectively. The two planets under analysis are highlighted with diamonds. The blue lines on the histogram, which shows the radius distribution of the sample, marks the radius values of the two targets.
Current usage metrics show cumulative count of Article Views (full-text article views including HTML views, PDF and ePub downloads, according to the available data) and Abstracts Views on Vision4Press platform.
Data correspond to usage on the plateform after 2015. The current usage metrics is available 48-96 hours after online publication and is updated daily on week days.
Initial download of the metrics may take a while.